1 50px
0 360°
0 360°
Quick how to use instructions
How the Fourier Transform Image Filter Tool works
To filter an image first upload the image, the tool performs an automatic colour 2D FFT which is shown on the image on the right. The controls under the images allow you to draw on the real and 2D FFT images you can use the colour select to draw in different colours. If you draw on the FFT image different areas of the FFT image will be masked, by selecting the invert checkbox subsequent drawing un-masks or inverts the perviously made drawing. The angle of the arc tool can be adjusted to select only certain angular orientations for the cicle draw tool. By clicking on the delete icon all drawing objects are removed from the FFT image. By clicking on the fill tool the entire FFT image is filled. An iFFT is preformed by clicking the iFFT button and if any of the FFT image has been masked the image will be filtered accordingly. At the moment only hard edged tools have been implemented so therefore you can observe some ringing artefacts, at a later date I might introduce a Guassian-like tool to minimise this.
On the left is the original (or filtered) image on the right the 2D FFT image. The FFT image displays the absolute value (or complex magnitude) of the spatial frequencies found in the image. An image is made of of RGB (and alpha transparency) pixels, these pixels are FFT’ed in turn to produce a colour 2D FFT. For each colour channel the amplitude of the frequency coefficient is displayed as its intensity and the wavelength or frequency as it radial distance from the center of the image with low frequency pixels in the center and high frequency at the edge of the image. The orientation of the frequencies can also be seen in the 2D FFT perpendicular or orthoganal to the image feature in the real image, so for instance a horizontal line will be observed in the 2D FFT as a vertical feature. Therefore to filter out the high frequencies in the image mask out all the FFT image except the center region visa versa to see the only the high frequency information mask out just the center part. To see horizontal lines in the image then mask everything except the vertical axis of the FFT image. By clicking the iFFT button the inverse Fourier Transform is performed and the original image is created from only the frequency information you choose to leave in the FFT.
A new feature of the Fourifier application is that you can also draw on the real space image (on the left) and Fourier transform the result, this is also interesting as you can see the frequency components of simple drawn objects (better to draw them against a black bround for this).
Some example instructions to filter an image in the Fourier domain
- 1) Click the load image button to load your own image or just use the preloaded lena image
- 2) Use the drawing tool to mask part of the image (eg. draw a filled circle in the center of the FFT image)
- 3) Click the iFFT button and your original image will be replaced by the high pass filtered version
- 1) load the new image as before
- 2) Use the drawing tool to mask part all of the image (try the square mask tool for this – right up to the corners)
- 3) Now select the inverse checkbox so that the drawing operation is inversed (the previously drawn shape will be erased by the new shape), then draw a small filled circle in the centre on top of the black image. You will be left will a small circle showing within a black FFT image. If its not quite centered then you can start again by clicking the red dustbin icon to erase all drawing.
- 4) Click the iFFT button and your original image will be replaced by the low pass filtered version
For a high pass filtered image
For a low pass filtered image
General information the Fourier Transform
What are waves
Waveforms are present whenever energy is present, they are normally observed when energy is transmitted in space as a travelling wave. Examples of these waves are, for example, acoustic energy being transmitted to the ear from the beating of a drum, or as light radiating from the sun, or waves in water transmitting kinetic energy released from the drop of a pebble. Energy as heat (infrared wavelength energy) is all around us and in the case of molecules cause the bonds between elements to vibrate. An experiment on the molecular sounds webpage allow these molecular vibrations to be ‘heard’ as sound. Microwaves vibrate water molecules in food transmitting energy and cooking the food. Energy can also be bound to objects, this is the result of attractive forces acting between objects, in this case the wave has the form of an orbital, examples of orbital waves are planets orbiting other larger objects like the sun another example on a smaller scale are quantum mechanical orbits of electrons around the nucleus, the strings in the string theory of subatomic particles. If you break open a circle you get a line of finite length therefore orbital waveforms are much like standing waves or waves that are constrained at each end. Standing waves have harmonic frequencies or waveforms that are an integral multiple of the fundamental frequency. The orbital harmonic waveforms are termed spherical harmonics as they are harmonic frequencies that exist on a sphere.

The Fourier Transform
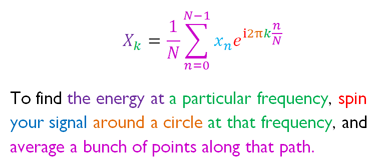
Joseph Fourier in 1822 found that sine and cosine waves can be combined by summation to create any kind of signal. The Fourier transform technique is used to decompose signals into their constituent waveforms in terms of their frequency, amplitude and phase. The waveforms are described in a circular form so that amplitude corresponds to the circle radius, the frequency the angular velocity around the circumference and the phase, the starting angle on the circle. The property of orthogonality is a critical property of Fourier transforms that allow different frequency sines and cosines to be combined yet give a signal with an mean of 0. Frequency decomposition is achieved by summing the contributions of sine waves at different frequencies. Since the waves are represented on the circular plane the equation is simplified to a summation of a harmonic frequency series (i.e. integral multiples of the fundamental harmonic frequency).

Prior to performing the FFT we must ensure that the data is sampled above the Nyquist frequency and convert our data to real and imaginary form (normally by setting the imaginary part to 0), it may also be necessary to window our signal in time for discontinuous functions (using for instance a Hanning function) or solely to avoid boundary effects. The end result of the FFT is a data vector the same length as the input vector containing complex numbers which we need to convert into real numbers by getting the complex magnitude (`|x| = sqrt(x_r^2*+x_i^2)`).
Image Fourier Transform (2D-FFT)
Images can also be thought of a signals in which pixel intensity is signal amplitude and displacement in X and Y the frequency component. In images the information is not normally periodic in space, however the Fourier Transform can still be used to decompose the image signal and give useful information. Convolution in real space is equivalent to multiplication in frequency space and the image can be easily filtered for high, low or orientated frequencies. The Fourier transform is a separable function and a FFT of a 2D image signal can be performed by convolution of the image rows followed by the columns. The 2D FFT operation arranges the low frequency peak at the corners of the image which is not particularly convenient for filtering. If the image is first multiplied by `-1^(i+j)` then the low frequency is centered in the image with higher frequencies radiating outward, orientation of the frequency component is dependent on its circular angle from the image center point. By masking out various regions of the 2D FFT different image filtering operations can be performed, for instance if the central low frequency peak is masked (by setting real/imag values to zero) a high pass filter image is obtained after a iFFT operation. If all of the FFT image is masked except for the central low frequency spike then a low pass filter is performed and if all of the image is remove except a narrow wedge then only these orientations will be present in the inverse Transform image.