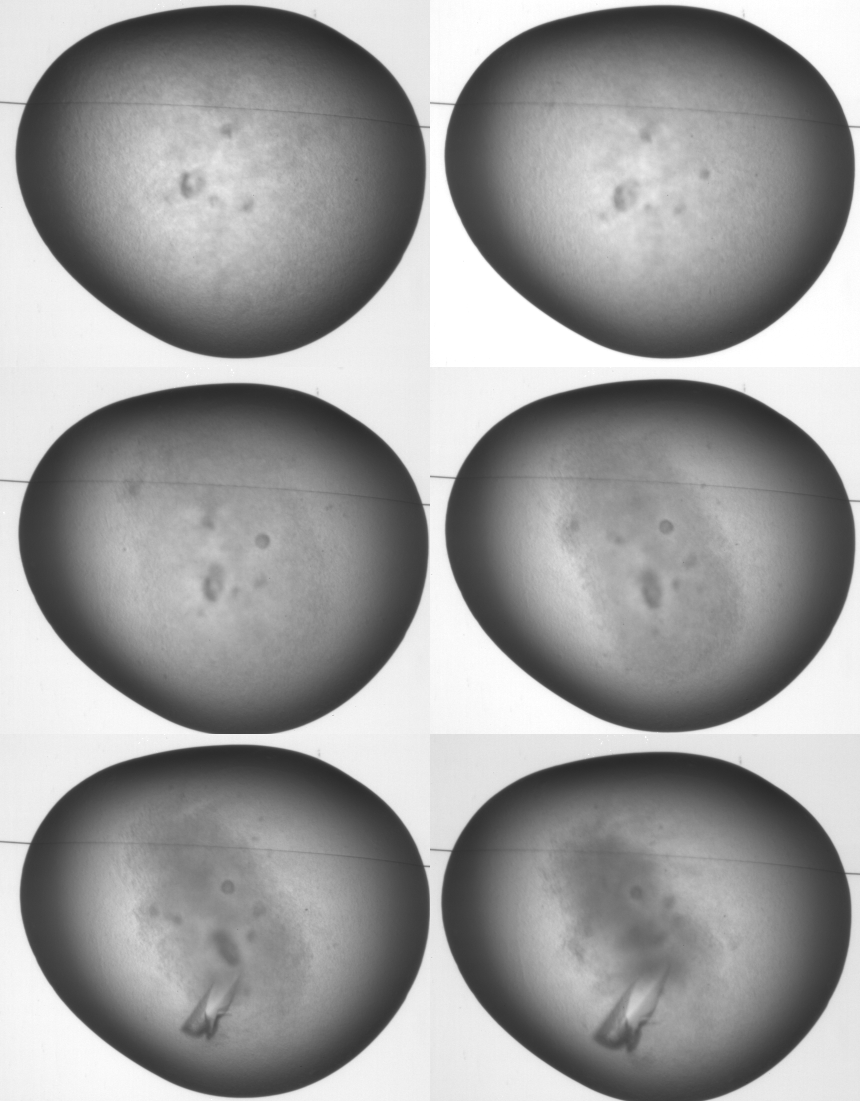
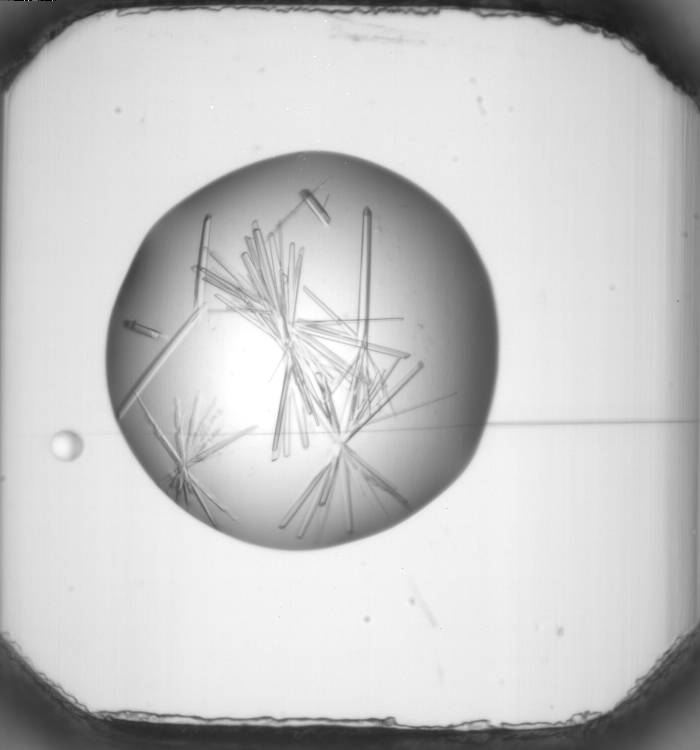
2) An example image from Oxford OPPF showing some nice crystals that should be classified automatically
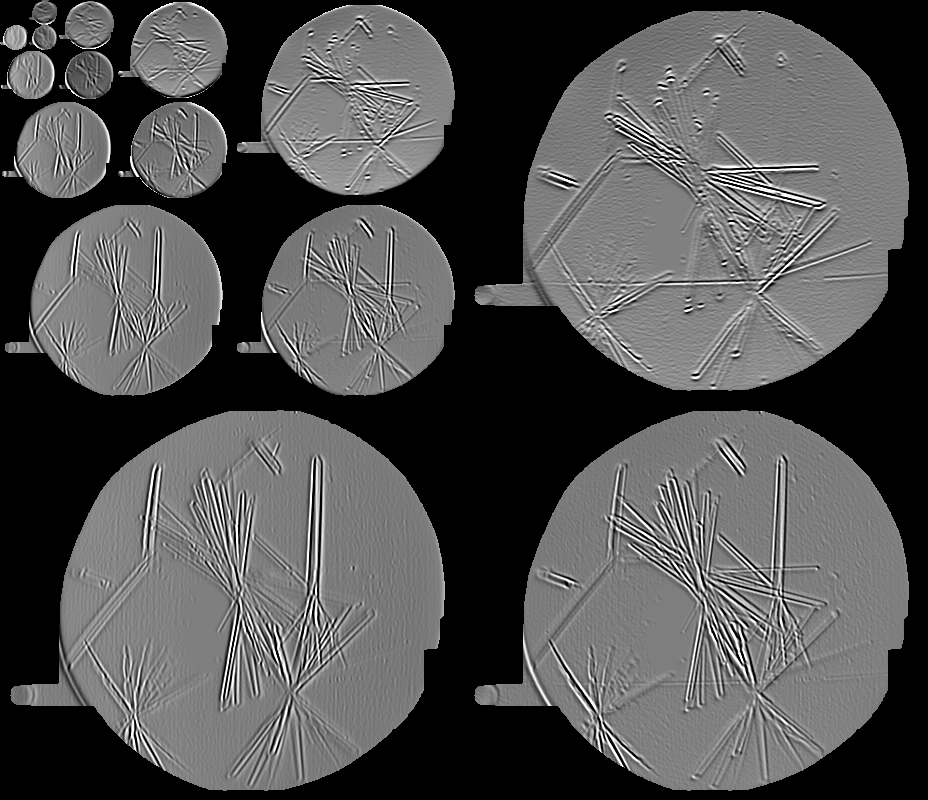
5 level Steerable pyramid decomposition of a crystal image (for ease of display one of the band images is missing)
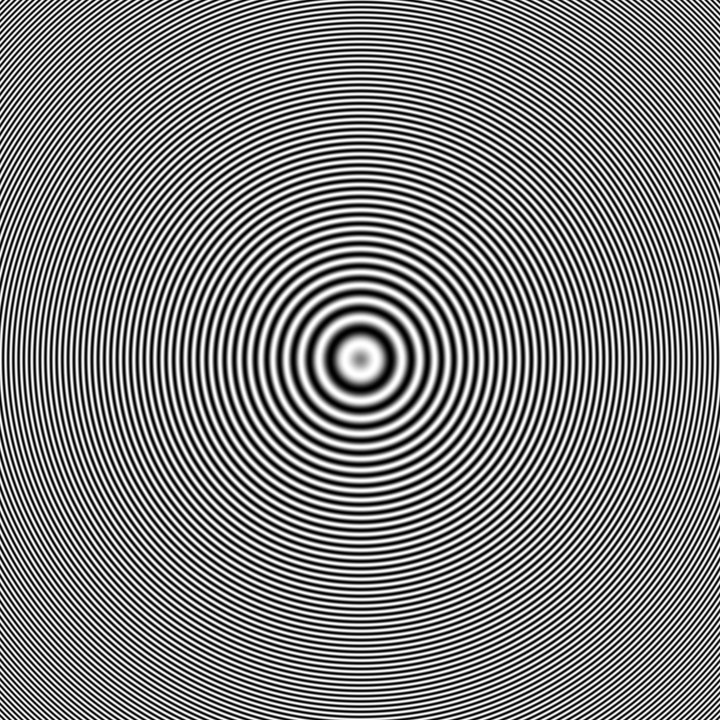
Steering quadrature zoneplate image
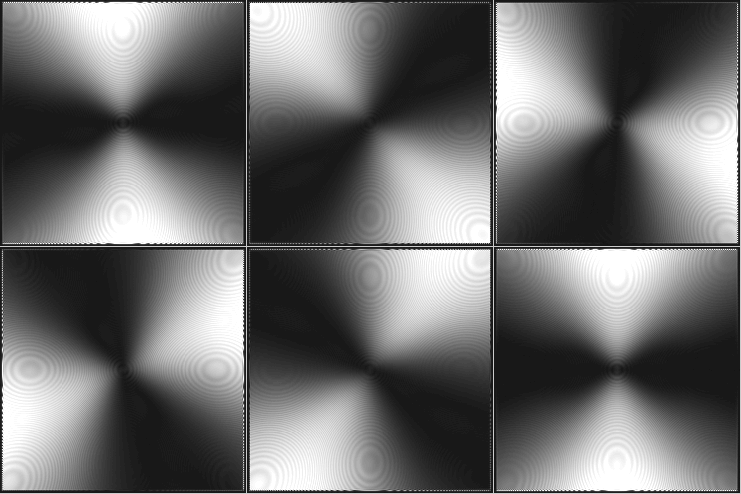
zone plate image (1) containing all spatial frequencies and orientations. The animation (2) shows the application of quadrature high pass steerable filter to the zoneplate image at changing orientations of the analyzing filter (360/32 degree intervals). The same filter is being used to steer the needle image shown in (3). When the orientation of the steerable filter aligns with orientation of the needle like crystals the steerable filter gives a maximal response. The halo patterns are the result of aliasing as the image size is too small to show the full spatial resolution of the frequency patterns in the zoneplate images.
(1)(2)(3)
Orientation images
The following images are obtained by the method of Freeman and Adelson (‘Design and use of steerable filters’ IEEE PAMI vol 13 no 9 (1991)). Based on the convolution of the image using quadrature filter
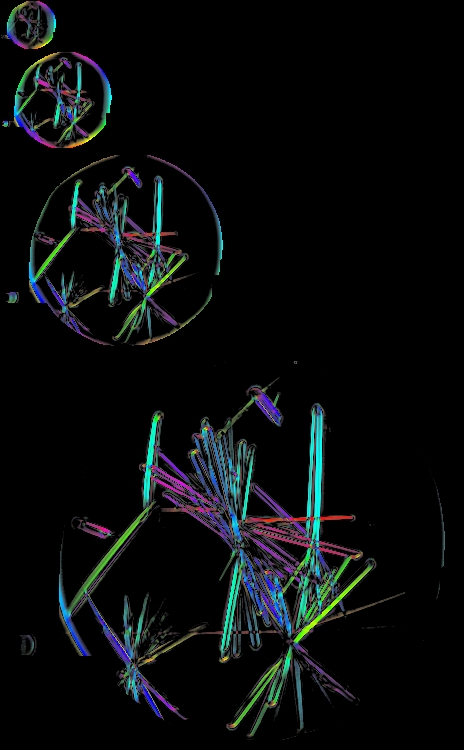
kernels.The image below is created by creating a pseudo colour image based on the colour hue coming from the orientation and the lightness and saturation
orientation magnitude, the hsv image is then transformed into the RGB image.
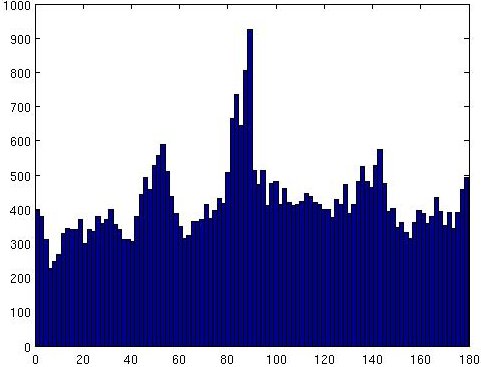
pseudo colour orientation image (1). Histogram of orientations given in one of the sub images above (Orientation in degrees) (2). The steerable filter produces the strongest response when aligned at the edge of the needle like crystals. The peaks in the histogram show that this happens often for this image at different orientations and suggests the presence of needle like crystals in the image. A peak detection measure for this histogram would therefore give an indication of long range edge alignment and the extent of crystallinity in the image. A suitable measure for this is Shannon entropy.
Optimally steered images
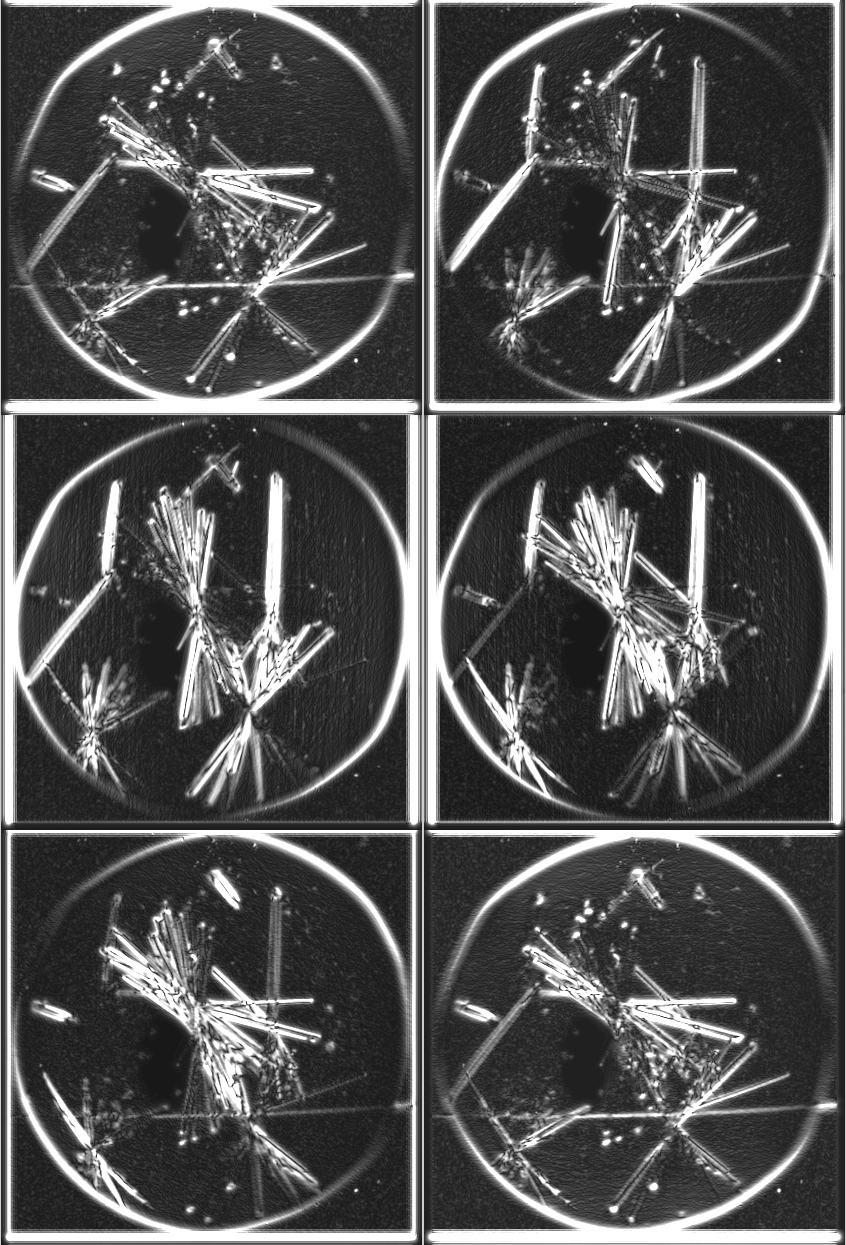
The images below have been created from steerable filters that have been optimally steered based on the orientation maximum local response of orientation image (shown above). (1) shows even filter image and (2) the odd filter image. The calculations have been performed on a pixel by pixel basis and it may be possible to improve the results (make more noise tolerant) by averaging the orientation over a local neighbourhood. The optimally steered images reduce the data present in the image. One could envisage that the image along with the local steerable filter angles could be used to perform an inverse transform and reduce the amount of data in image compression applications in much the same way that a FFT image can be inverted using the magnitude and phase information of the decomposed image.
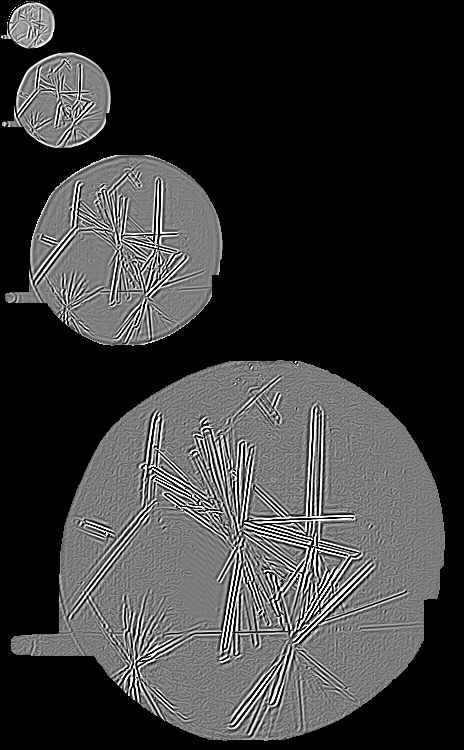
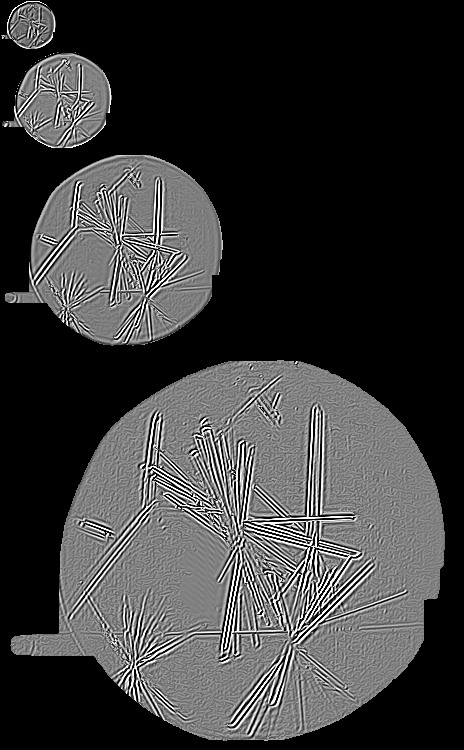
(1) (2)
Classification results
Getting pretty good results from marginal (first order) statistics on the full steerable pyramid decomposition images (using lvq’s as a classier). The technique used to classify the crystals is described in detail in the paper below. The results are slightly better than achieved with wavelet decomposition I hope to improve the results further using an optimally steered pyramid image and from quadrature steerable images.
percentages that real classes are classed by the computer as:| class type [number of images] | 6 | 5 | 4 | 3 | 2 | 1 | 0 | class scores |
| class 6 [149] | 38.9 | 20.8 | 19.5 | 7.4 | 1.3 | 0.7 | 11.4 | 68% |
| class 5 [145] | 18.6 | 20.0 | 39.3 | 9.7 | 1.4 | 5.5 | 5.5 | 70% |
| class 4 [147] | 21.1 | 14.3 | 17.0 | 9.5 | 8.8 | 16.3 | 12.9 | 63% |
| class 3 [149] | 13.4 | 6.0 | 10.1 | 26.8 | 17.4 | 18.1 | 8.1 | 74% |
| class 2 [135] | 3.7 | 0.0 | 3.0 | 11.9 | 74.8 | 5.9 | 0.7 | 92% |
| class 1 [148] | 10.1 | 4.1 | 8.8 | 3.4 | 4.7 | 68.2 | 0.7 | 80% |
| class 0 [145] | 4.1 | 0.7 | 0.0 | 1.4 | 0.0 | 2.1 | 91.7 | 94% |
Steerable Pyramid References that I have found useful:
“Texture Analysis Using Two-Dimensional Quadrature Filters”, H. Knutsson, G. H. Granlund, IEEE Computer Society Workshop on Computer Architecture for Pattern Analysis and Image Database Management – CAPAIDM
W. T. Freeman and E. H. Adelson, The design and use of steerable filters,
IEEE Trans. on Pattern Analysis and Machine Intelligence,
vol. 13, no. 9, pp. 891 – 906, September, 1991.
MIT Vision and Modeling Group TR 126.
E. P. Simoncelli, W. T. Freeman, E. H. Adelson and D. J. Heeger. Shiftable Multi-Scale Transforms.
IEEE Trans. Information Theory, Special Issue on Wavelets.
Vol. 38, No. 2, pp. 587-607,
J Portilla and E P Simoncelli.A Parametric Texture Model based on
Joint Statistics of Complex Wavelet Coefficients.
Int’l Journal of Computer Vision. 40(1):49-71, October, 2000.
J Portilla and E P SimoncelliTexture Modeling and Synthesis using Joint Statistics of Complex Wavelet Coefficients.
IEEE Workshop on Statistical and Computational Theories of Vision,
Fort Collins, CO, 22 June 1999
“Multiresolution Techniques in Microscopical Image Processing”, F. Rooms, W. Philips, in G.I.T. Imaging & Microscopy 4/2002, pp 60 61, GIT VERLAG GmbH & Co. KG, D-64220 Darmstadt,
“Simultaneous degradation estimation and restoration of confocal images and performance evaluation by colocalization analysis”, F. Rooms, W. Philips, D.S. Lidke, Journal of Microscopy, Blackwell Publishing, vol. 218, nr. 1 (April 2005), pp 22–36.