Image analysis of protein crystallisation experiments
This page describes some work performed to classify crystallisation images from high throughput protein crystallisation systems (HTPX).
In this work all objects in the image are classified as identification of the precipitate along with the crystals will give more information about the crystallisation phase of the system than will identification of crystals alone.
The first stage of analysis involves detection of the crystallisation drop area and masking of any artefacts such as moulding lines (fig. 1-3). This is a non trivial task as drop edges can be very faint in appearance. The presence of satellite drops and other artefacts further complicates this task.
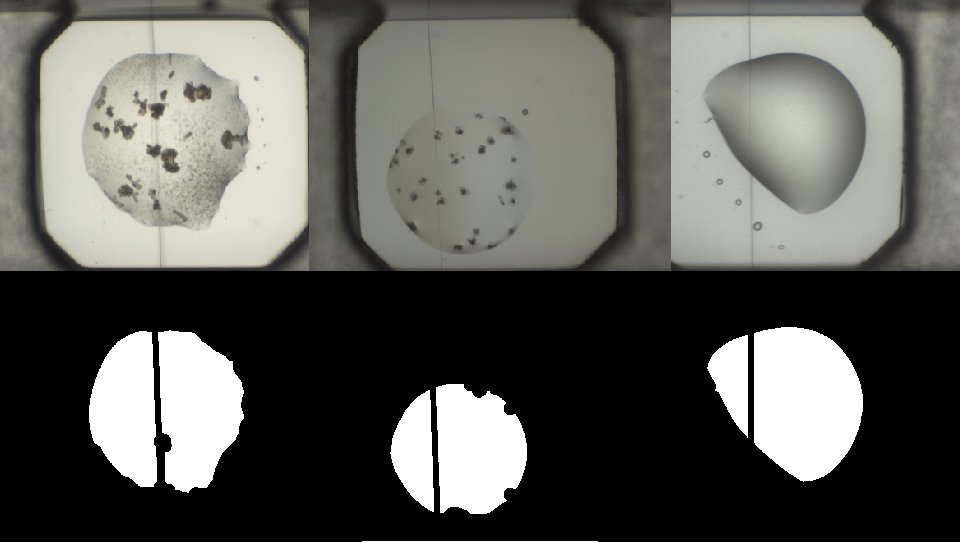
(1)(2)(3)
Below is an example of a processed image, masking of drop and horizontal moulding line, thresholding of objects then connected component analysis of each individual object (fig. 4).
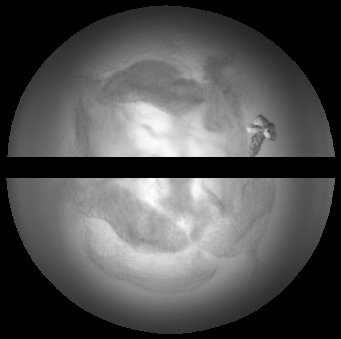
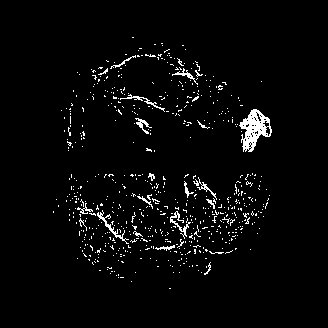
The analysis of the connected components as a 2D histogram shows grouping of the objects according to greyscale intensity and object size (fig. 5). This histogram shows the results of analysing the first crystallisation image shown on this page (fig. 1).

(5)
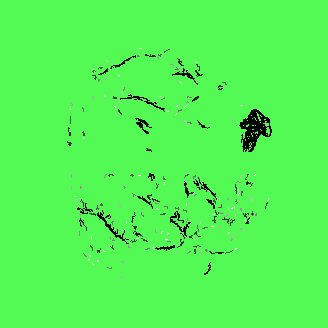
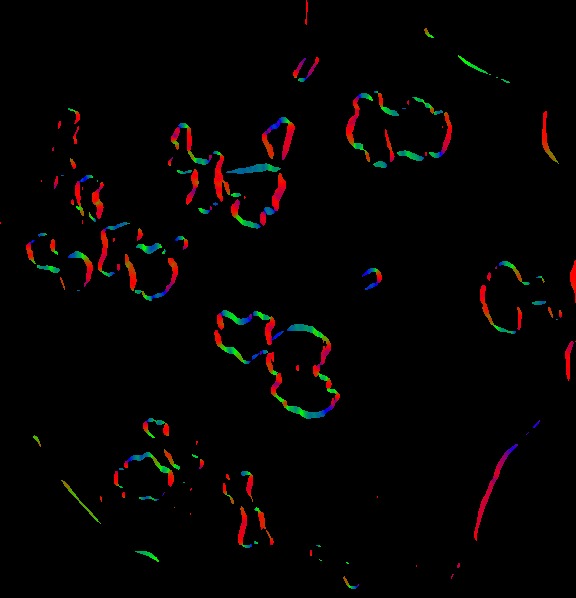
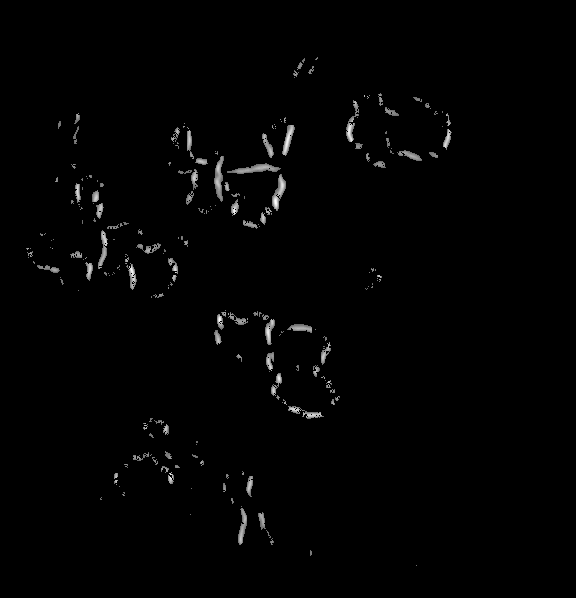
In figure 6 a steerable pyramid orientation analysis was performed on the crystallisation image in figure 1. A Hough transform was used to detect lines in the image. Hough transforms perform an accumulator binning of pixels according to the equation of straight lines passing through each binary pixel. The binning is performed for each angle bin describing all possible lines that potentially pass through the pixel and for a distance orthogonal to the axis point. The knowledge of the orientation at each pixel enables one pixel to contribute to only one bin in the 2D hough transform matrix. This reduces data redundancy and more importantly enables the inversion of the Hough transform. If only those bins greater than a threshold are kept and the Hough transform inverted the straight lines segments can be directly determined (fig. 7). These straight line are more likely to correspond to crystal edges and are important feature in crystal classification.
(6)(7)
The accurary of the orientation determined by the steerable filter depends on the narrowness of orientation selectivity of the steerable filters used. In this example 9 orientation filters (5+4, even and odd phase) are used at each level.