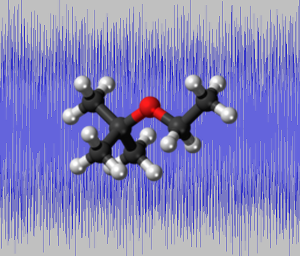

Video showing how to use the molecular sounds keyboard
How the molecular sounds were created
Molecules are groups of connected elemental atoms. The atoms share some of their electrical energy to form a bond with other atoms. The bonds have different energy depending on which the type of atom involved in the bond, the type of bond itself and the local electronic charge at the atom. Energy at the atomic level has a distinct orbital structure and electrons exist in quantum energy levels. When the bonds between the atoms absorb infra-red energy they vibrate. The absorption of the energy can be seen in an Fourier Transform infra-red spectrum as peaks at certain energy levels. A skilled Organic Chemist can look at the peak position and form and qualitatively determine certain characteristics of the molecule, for instance if the molecule is aromatic or aliphatic and the functional groups present such as alcohol, or amine groups.
A vibrating molecular bond is similar to the standing waveform string of plucked musical string or a struck drum head, in this case though energy is emitted and not absorbed and the energy is in the form of sound. The Fourier transform gives the exact frequency and amplitude of absorption of the bonds in the molecule, however this is not form in which audio information is processed by humans which is in the time/amplitude domain. If a Inverse Fourier transform is performed then the Fourier Transform infrared spectrum can be converted into the time/amplitude domain and the vibrations of the molecules heard.
Extracting audio from the molecular FTIR spectrum
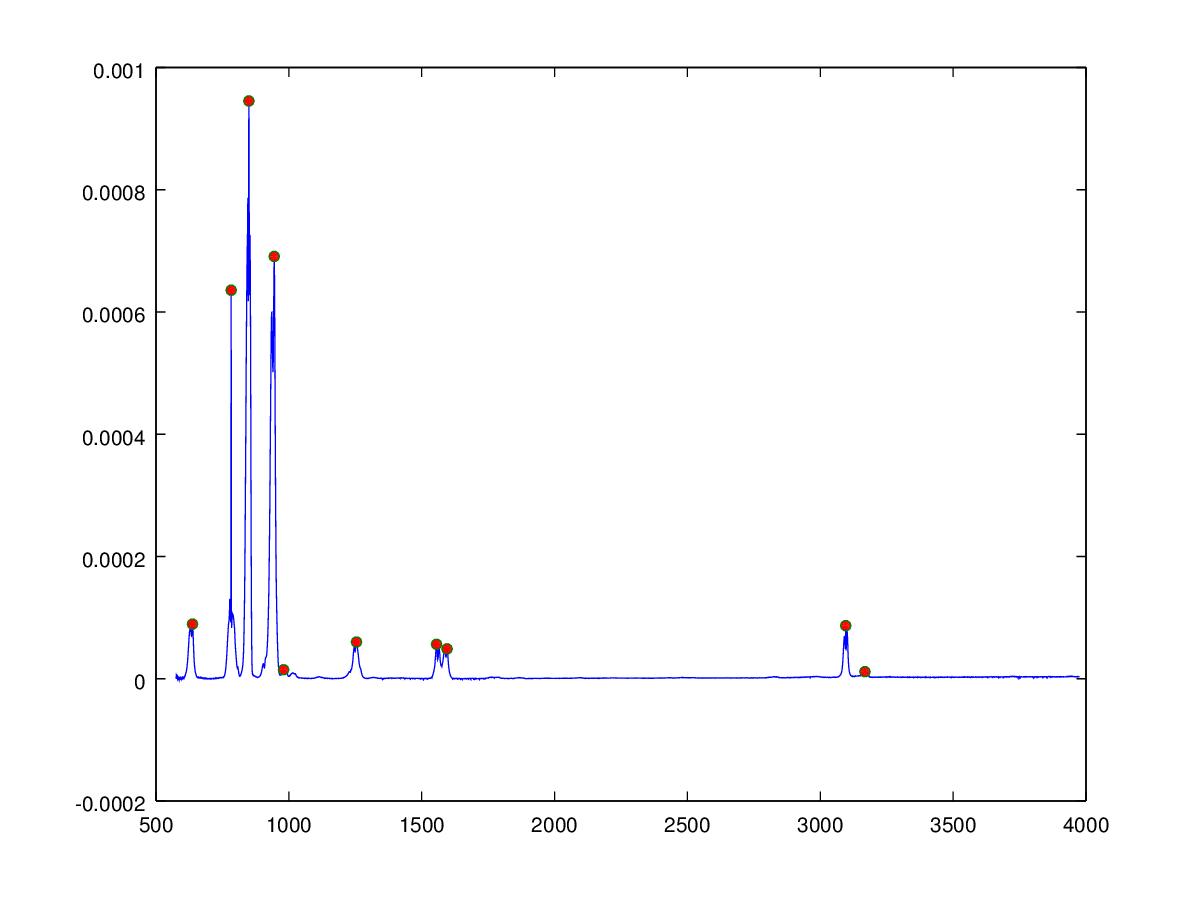
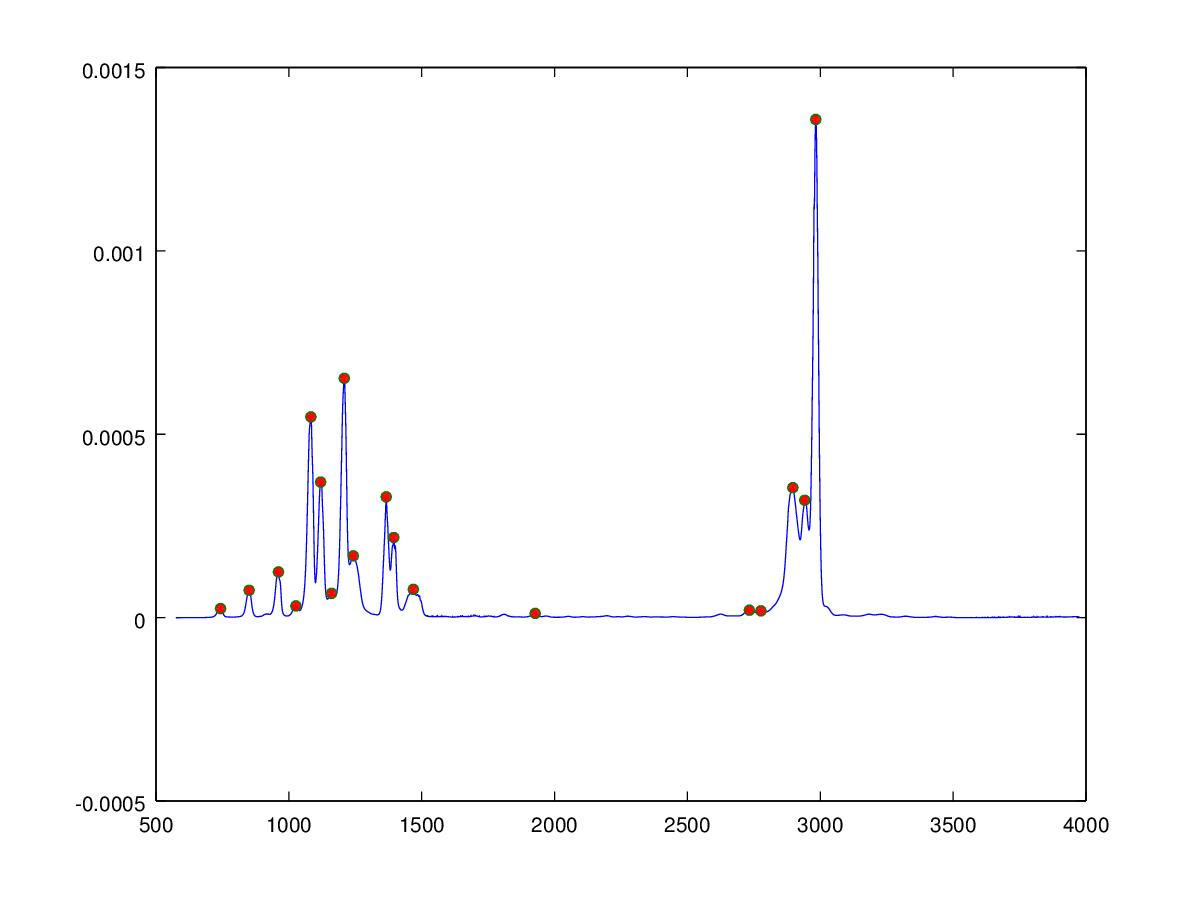
The inverse Fourier transform requires the phase to be known in addition to the frequency and amplitude, which in the case of the infrared spectrum is unknown, we can however also reconstruct the audio signal by creating sine waves at the correct frequency and amplitude. The phase of the sine waves are unimportant since the waveform is unchanging over time and the human auditory system is unable to detect the phase of the signal providing the phase does not change in time. The Matlab/Octave algorithm below uses a algorithm to determine peak positions (shown as red dots in the figure below) from which sine waves are created and summed to give the audio signal. The molecules are ordered according to the weighted mean of the peaks determined in the spectrum, this gives an approximate increase in musical pitch from left to right across the keyboard.
The IR data is obtained from the Quantitative Infrared Database as a JCampDX file which can be read in Matlab or octave using the jcampread function.
About the Molecular Sounds Application
The Molecular Sounds application allows you to listen to the sounds of organic chemical molecules using a keyboard. When the key is pressed a sound of the molecule is played and the structure and FFT spectrum displayed. The keys are ordered like a piano or synthesizer and can be played simultaneously and using the computer keyboard.

Computer Octave/Matlab code for infrared spectrum to audio conversion
% Matlab/Octave function to read a jcamp-dx file and create molecular audio sound

function createMolecularSound(filename)
	% set up frequency parameters
	Fs = 8000;                   % samples per second
	dt = 1/Fs;                   % seconds per sample
	StopTime = 5;                % length of audio segment
	t = (0:dt:StopTime-dt)';     % time vector

	% read the FTIR file
	jcampStruct = jcampread(filename);

	% get the data
	data = jcampStruct.Blocks(1);
	X = data.XData;
	Y = data.YData;

	% find peaks in spectrum
	peaklist = SimplePeakFind(50, Y, 1e-5);

	% plot peaks
	h=figure;
	plot(X,Y,X(peaklist),Y(peaklist),"o","markersize",5,"markerfacecolor",[1,0,0]);

        % save the peak find plot
	saveas(h,regexprep(filename,".jdx",".jpg"),'jpg')

	% create the frequencies
	sig = sum(Y(peaklist).*sin(2*pi*X(peaklist).*t),2)';

        % stats to determine data range
	sig(sig>mean(sig)+2.5*sqrt(var(sig)))=mean(sig)+2.5*sqrt(var(sig));
	sig(sig% normalise data
	sig=sig/(2.5*sqrt(var(sig)));

	% save audio file
	wavwrite(sig,Fs,regexprep(filename,".jdx",".wav"));

	end
here is the simple peak find function
function p = find_peaks( data, num )

        cur = data(1);
        mn = cur;
        dir = 0;

        peaks = [];

        for i = 2:length(data)
                s = sign( data(i)-cur );
                if( s != dir )
                        dir = s;

                        if( dir < 0 )
                                peaks	= [peaks; i, data(i)];
                        endif
                endif

                cur = data(i);
                mn = min(cur,mn);
        endfor

        l = rows(peaks);
        if( num > l )
                num = l;
        endif

        % Ensure we are using a matrix, otherwise sort treats it as a vector
        % we should populate this with the minimum value actually... (TBD)
        if( l == 1 )
                peaks = [peaks; 0, mn];
                l = 2;
        endif

        [ spv, spi ] = sort( peaks );

        p = [];

        for i = 0:(num-1)
                p = [p; peaks( spi(l-i,2), 1 ), peaks( spi(l-i,2), 2 ) ];
        endfor

endfunction
The jcampread file can be downloaded from here