Beauty in irrationality?
Plotting irrational numbers (pi, e, sqrt2, golden ratio) as vectors allows their complexity to be visualisedI have always wanted to visualise irrational numbers. Our brains are capable of recognising patterns in nature and I wanted to know if these patterns could be visualised in irrational numbers, and whether beautiful patterns could be seen that could lead to an further understanding of the irrational nature of the numbers. Just found out after publishing this article that the idea has been round for a while! (here is an interesting blog article). Here I have extended the technique to 3 dimensions for better visualisation and give results and computer code.
Experimental Technique
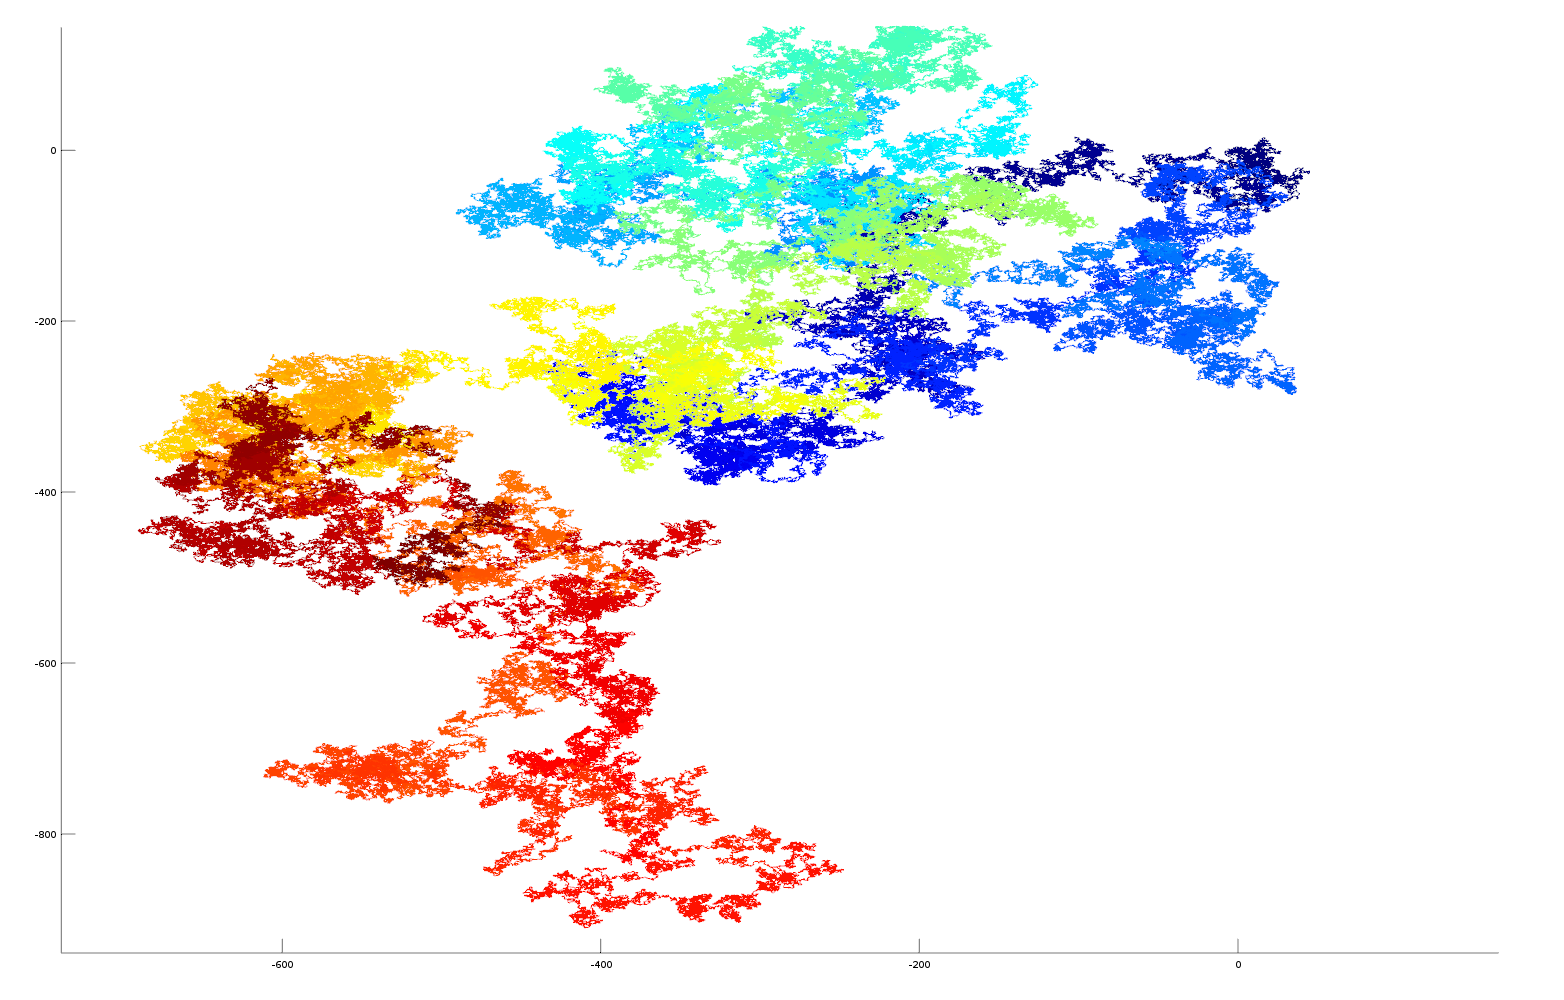
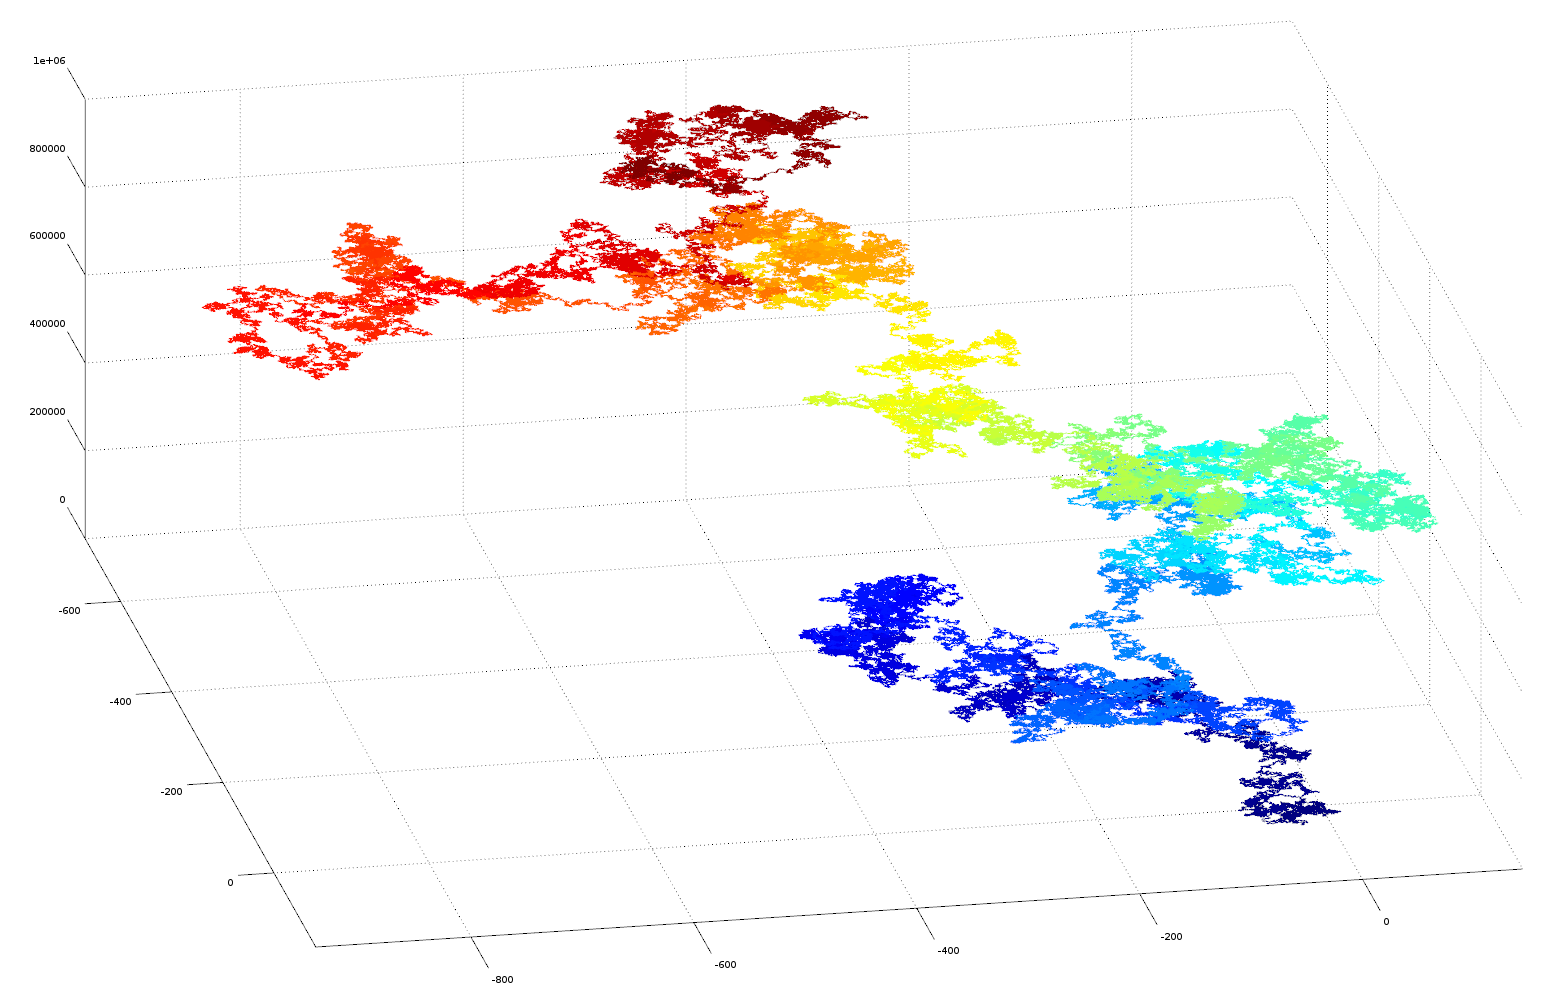
In this experiment the fractional parts of the irrational numbers, pi, e, sqrt2 and golden ratio are transformed into vectors in cartesian space for visualisation purposes. Each digit of the number sequence (from left to right) is transformed into a spatial vector with unit length. The orientation is calculated from the number as: angle = (digit/10)*2*pi. Sine and cosine functions are used to derive a position in the cartesian plane relative to the position of the previous digit (see code below for more details). As the irrational number is described to greater precision its decimal place increases, this occurs on the number string from left to right. As we are traversing the number sequence this corresponds to increasing time steps of the number analysis. On the plots the sequence position of the digit (its decimal place) is colour coded using a heat mapping (blue->red on increasing significant digits). The 3D plots also gives the sequence position of the digit on the Z axis, this helps to separate overlapping sequences in cartesian space.
Visualisation/Results
These plots are the results of the analysis, please click them for more detail
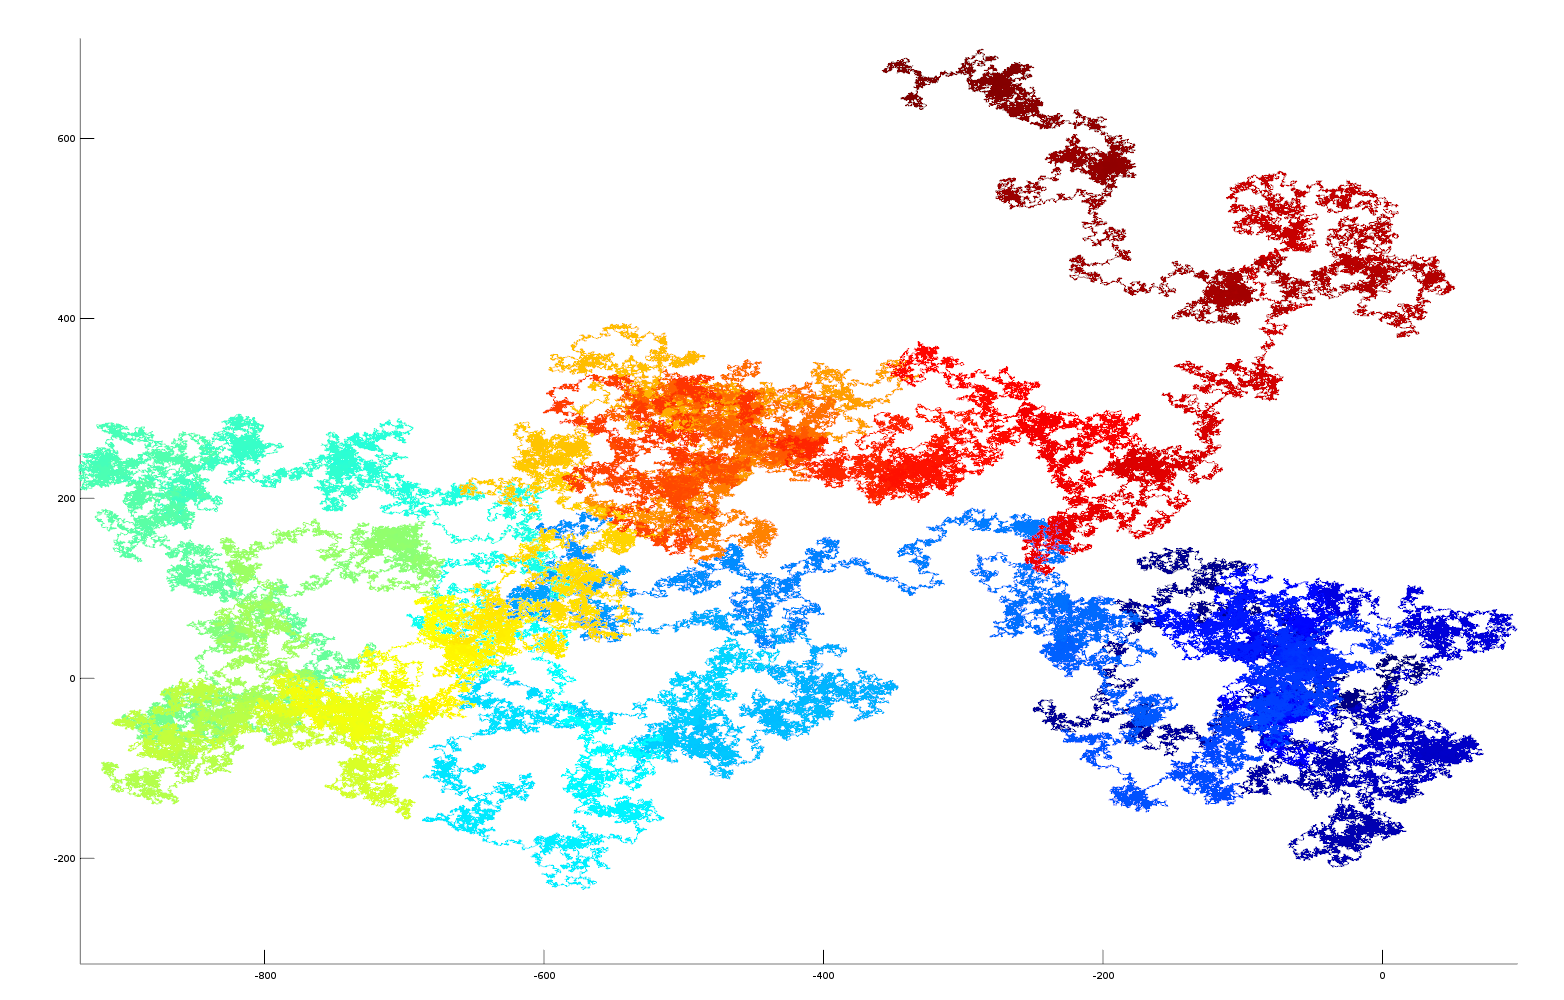
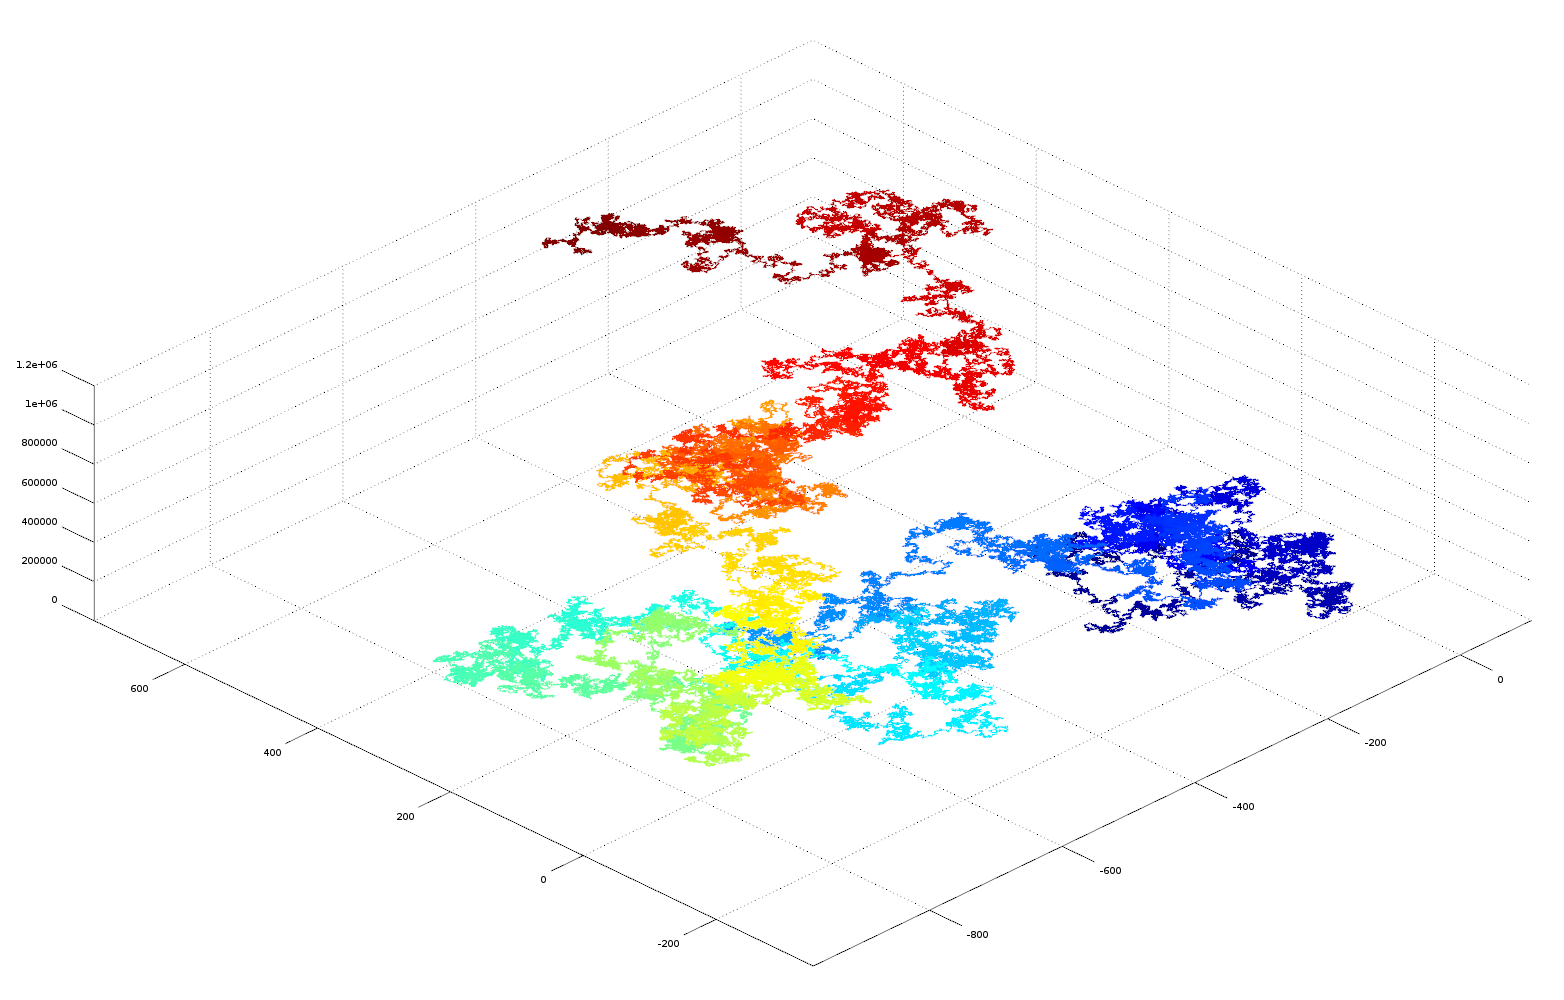
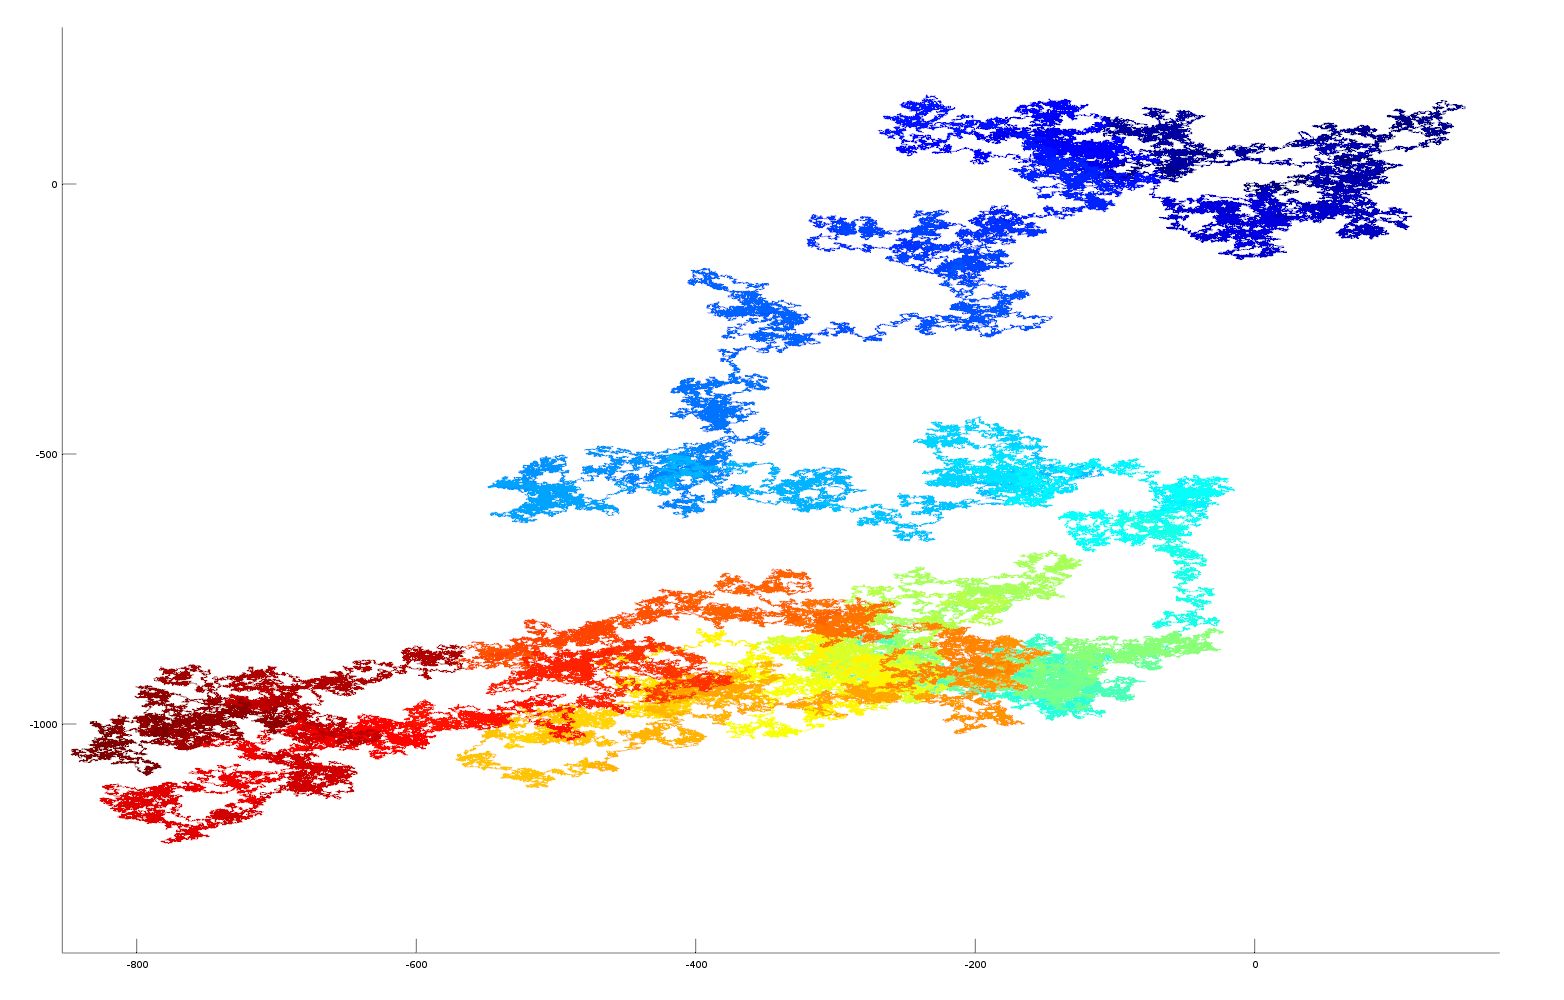
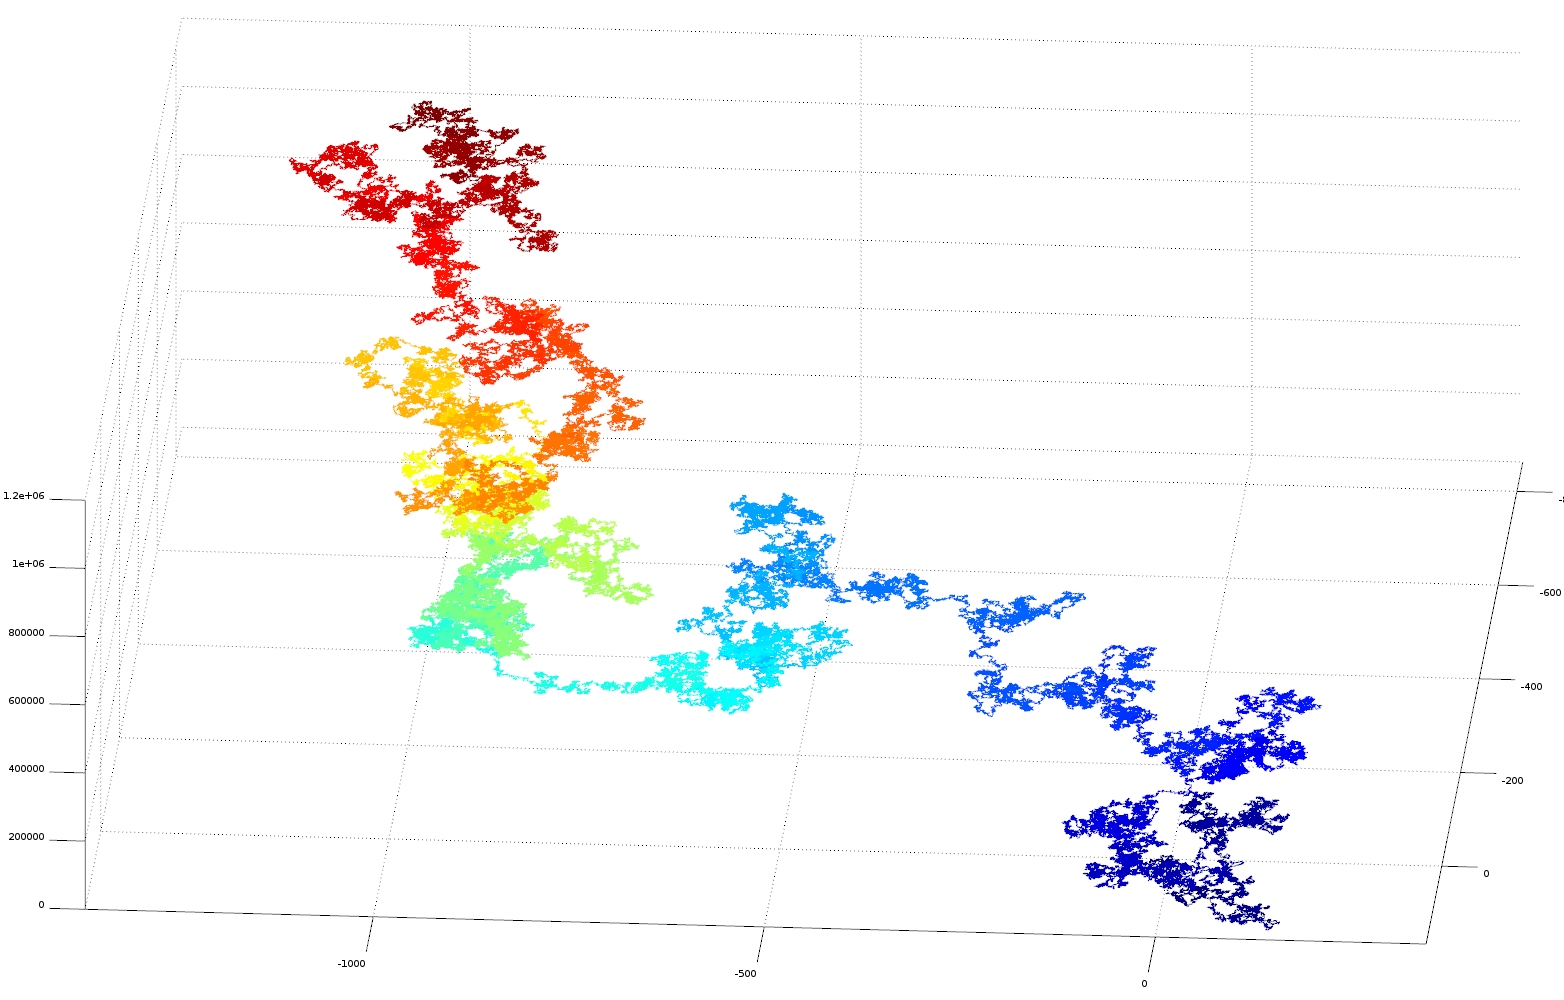
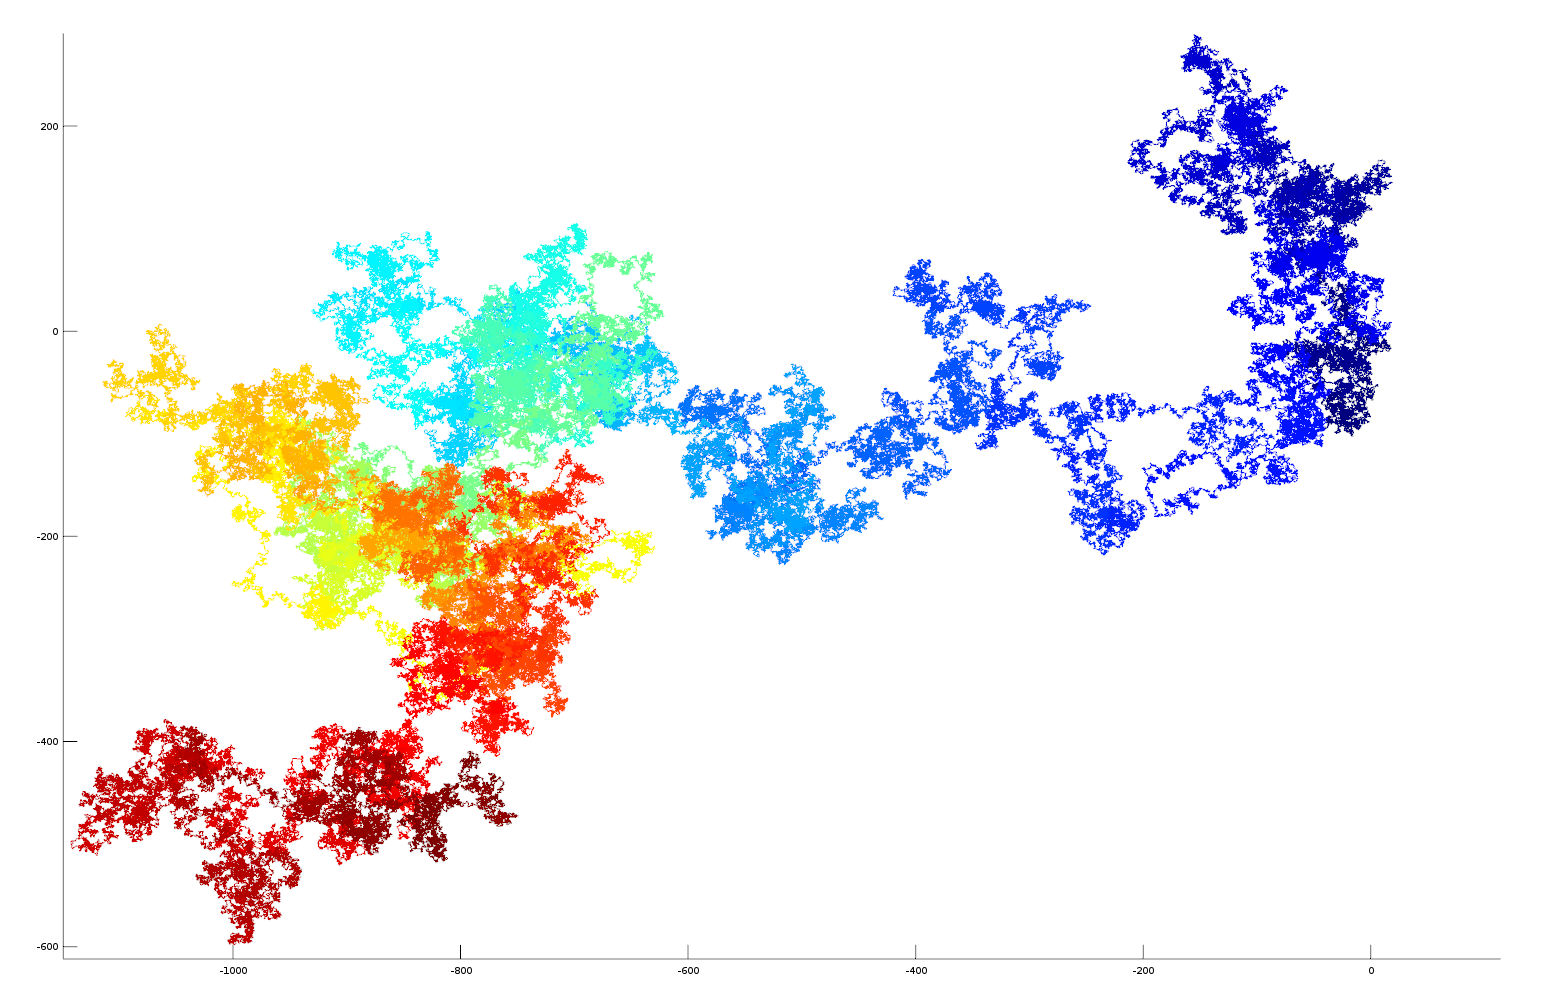
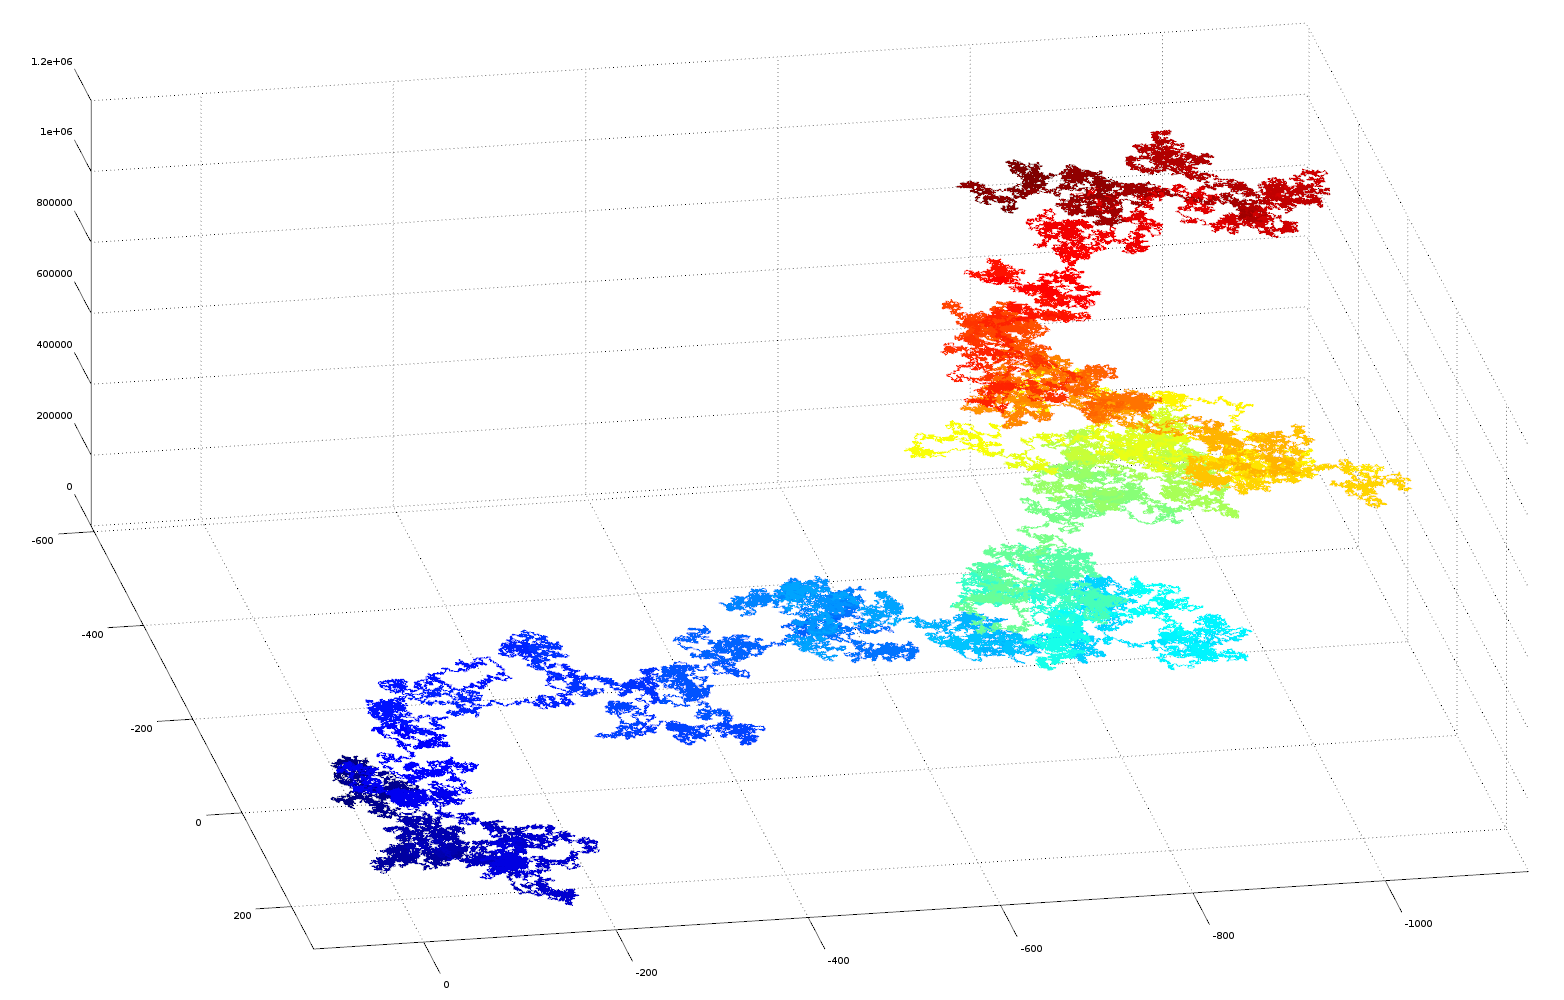
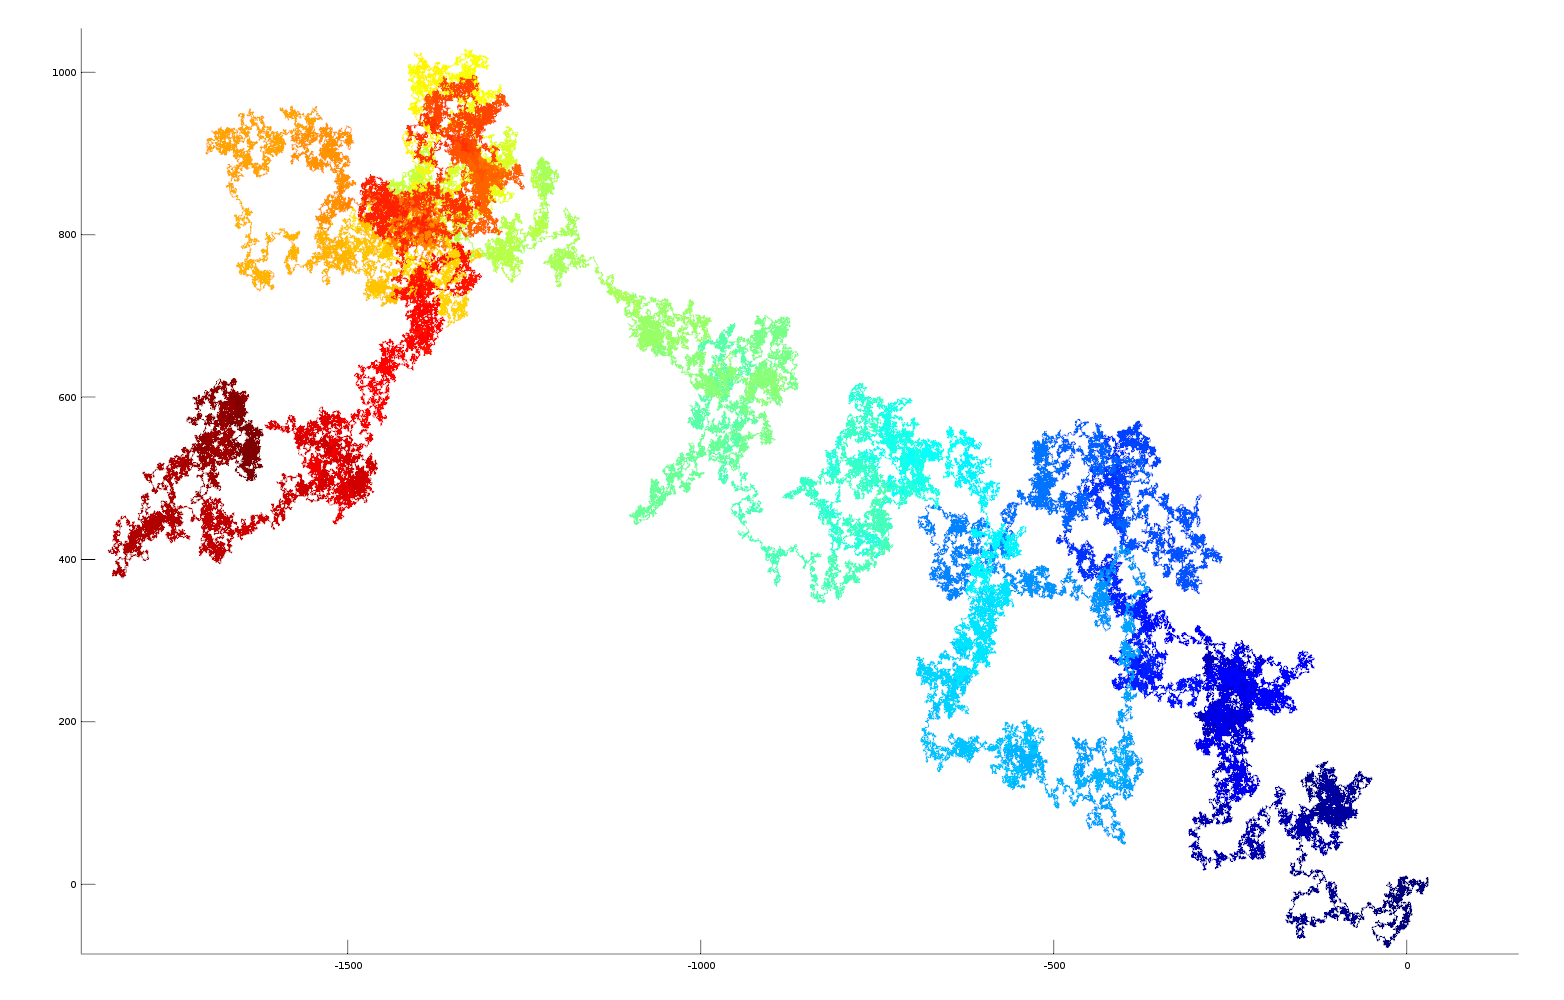
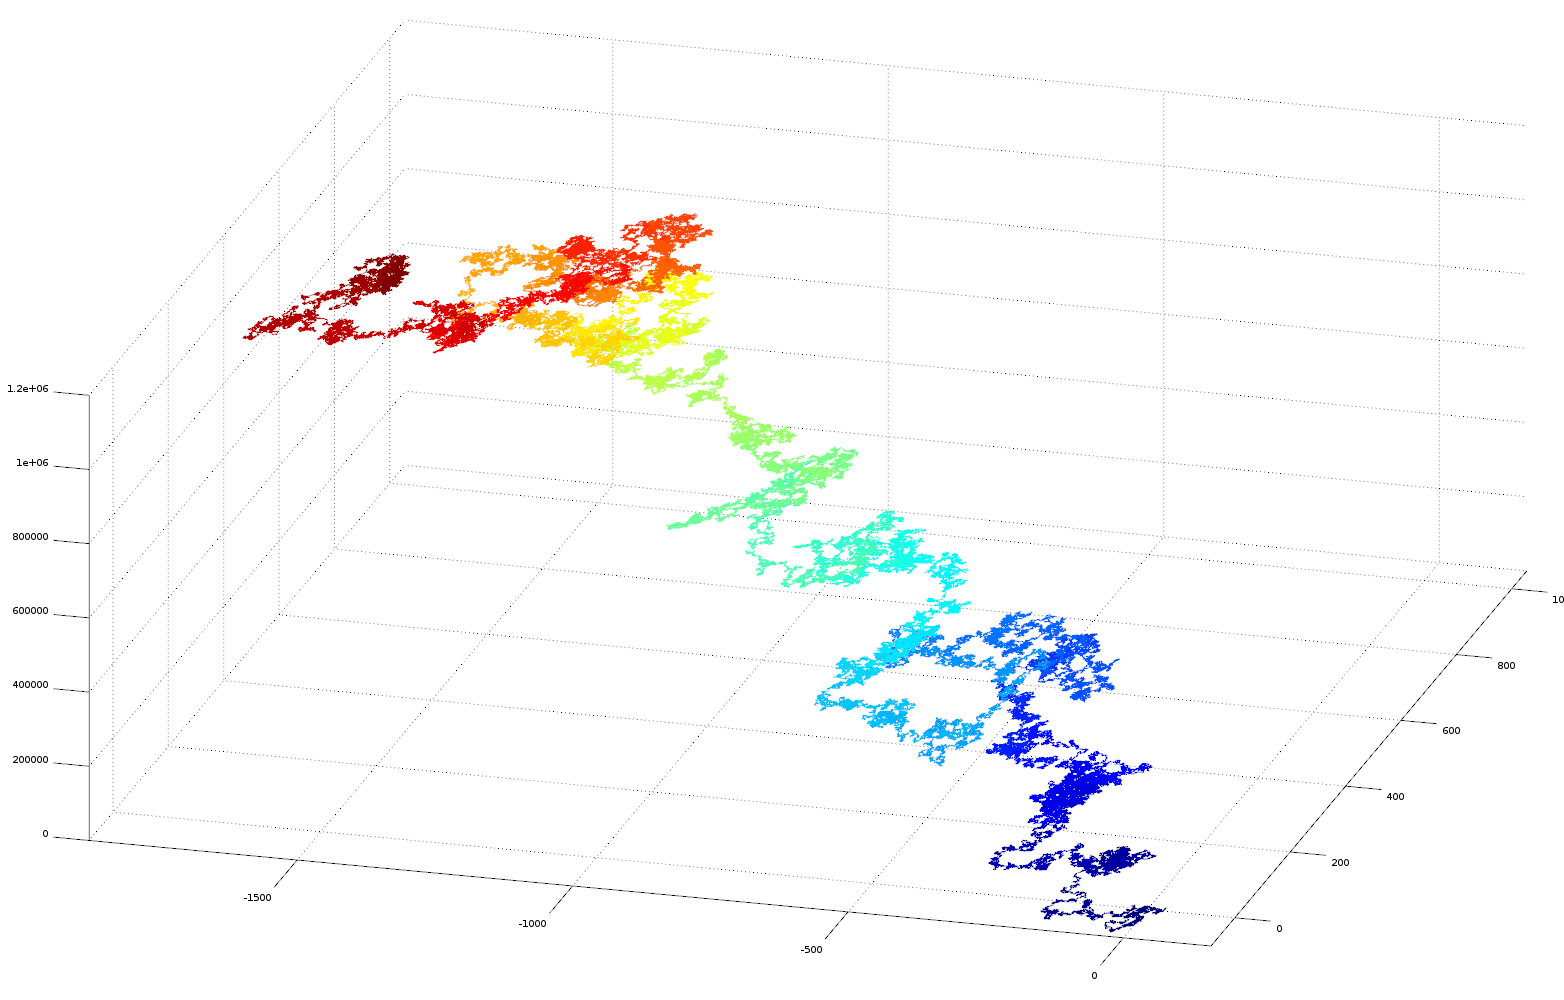
Here is a vector plot of 1 million random number generated numbers
Data and Matlab/Octave computer code
Below is the Matlab/Octave code used for generating the plots. Data can be downloaded here: pi, e, golden ratio, sqrt2 (data is without decimal point!)
function  irrational_number_plot_as_vector(filepathname)
%   requires file name containing string of irrational number delete decimal point from string ie 3.14... -> 314...

% read text file containing number
format = "%1c"

fileID = fopen('pi.txt','r');

p = fscanf(fileID, format);

_p=0;

% convert character string to matlab array
for i=1:length(p); _p(i)  = str2double(strcat(p(i),".0")); end

% create arrays for plotting
x_array = zeros(1,length(_p));
y_array = zeros(1,length(_p));

% polar angle
for i=2:length(_p); x_array(i) = x_array(i-1)+cos((_p(i-1)/10.0)*2.0*pi); y_array(i) = y_array(i-1)+sin((_p(i-1)/10.0)*2.0*pi); end

% surface plot with z axis and colour blue->red as increased fractional part
h = surface([x_array(:), x_array(:)], [y_array(:), y_array(:)], [[1:length(_p)]', [1:length(_p)]'], [[1:length(_p)]', [1:length(_p)]'], 'EdgeColor','flat', 'FaceColor','none');

end