jQuery-ui horizontal menu made easy

This is some code for building a jquery ui horizontal menu. It is based on code by https://codepen.io/seungjaeryanlee/ and modified for icon support and to create a menu automatically from a JSON schema. It’s pretty useful for HTML5 app development.

menu created from JSON
Menu created from JSON schema

HTML

This is how the menu would look be structured if just coded in html

<ul id="menubar">
  <li><div class="icon"><span class="ui-icon ui-icon-folder-open"></span><a href="#">Alpha</a></div>
     <ul>
      <li><div><a href="#">Beta 1</a></div></li>
      <li>
        <div class="icon"><span class="ui-icon ui-icon-folder-open"></span><a href="#">Beta 2</a></div>
        <ul>
          <li><div class="icon"><span class="ui-icon ui-icon-folder-open"></span><a href="#">Beta 2a</a></div></li>
          <li><div><a href="#">Beta 2b</a></div></li>
        </ul>
      </li>
      <li><div><a href="#">Beta 3</a></div></li>
    </ul>
  </li>
  <li>
    <div><a href="#">Beta</a></div>
    <ul>
      <li><div><a href="#">Beta 1</a></div></li>
      <li>
        <div><a href="#">Beta 2</a></div>
        <ul>
          <li><div><a href="#">Beta 2a</a></div></li>
          <li><div><a href="#">Beta 2b</a></div></li>
        </ul>
      </li>
      <li><div><a href="#">Beta 3</a></div></li>
    </ul>
  </li>
  <li><div><a href="#">Gamma</a></div></li>
  <li><div><a href="#">Delta</a></div></li>
 </ul>

javascript

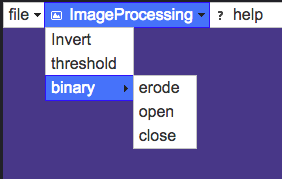
menuStructure is the JSON menu descriptor, the code setUpMenuHTML and addMenuHTML create HTML from this schema in the format of the html above.

var menuStructure = {menu: [
                        { name: "file",  
                          menu: [
                              {name: "Open", icon: "ui-icon ui-icon-folder-open"}, 
                              {name: "save", icon: "ui-icon ui-icon-disk"}
                          ]
                         },
                        {name: "ImageProcessing", icon: "ui-icon ui-icon-image",
                         menu: [
                             {name: "Invert"}, 
                             {name: "threshold"}, 
                             {name: "binary", 
                              menu: [
                                    {name: "erode"}, 
                                    {name: "open"}, 
                                    {name: "close"}
                                    ]
                             }
                            ]
                        },
                        {name: "help", icon: "ui-icon ui-icon-help"}
                    ]};
    

function addMenuHTML(ME, $selector)
{
    var $ulOuter = $selector;
    
    if(!$selector.is('#menubar'))
        $ulOuter = $("
    ").appendTo($selector); for(var j=0;j").appendTo($ulOuter); if(ME.menu[j].icon) { str = '
    '+ME.menu[j].name+'
    '; } else{ str = '
    ' + ME.menu[j].name + '
    '; } $(str).appendTo($liInner); // call recursively on nested menu elements if(ME.menu[j].menu) addMenuHTML(ME.menu[j], $liInner); } } function setUpMenuHTML() { var $menu = $('#menubar'); $menu.empty(); addMenuHTML(menuStructure, $menu); } function setUpMenu() { $('#menubar').menu(); $('#menubar').menu({ position: { my: 'left top', at: 'left bottom' }, blur: function() { $(this).menu('option', 'position', { my: 'left top', at: 'left bottom' }); }, focus: function(e, ui) { if ($('#menubar').get(0) !== $(ui).get(0).item.parent().get(0)) { $(this).menu('option', 'position', { my: 'left top', at: 'right top' }); } }, }); } $(document).ready(function() { setUpMenuHTML(); setUpMenu(); });

    css

    the CSS ensures that the menuu is horizonal and that the icons are correctly displayed next to the menu names and that the sub menus also indent correctly

    #menubar {
      position: fixed;
      top: 0;
      left: 0;
      width: 100%;
    }
    
    ul > li a{
      max-width:100%;
      color: inherit; /* blue colors for links too */
      text-decoration: inherit; /* no underline */
    }
    
    li > div {
      white-space: nowrap;
      overflow: hidden;
    }
    
    /* Make jQuery UI Menu into a horizontal menubar with vertical dropdown */
    #menubar > li { /* Menubar buttons */
      #text-align: center;
      display: inline-block;
    }
    
    #menubar li > div:not(.icon) {
      padding-left: 0.3em !important;
    }
    
    #menubar li > div.icon {
      padding-left: 1.5em;
    }
    
    #menubar > li > ul > li { /* Menubar buttons inside dropdown */
      display: block;
    }
    
    /* Change dropdown carets to correct direction */
    #menubar > li > div > span.ui-icon-caret-1-e {
      /* Caret on menubar */
      background:url(https://www.drupal.org/files/issues/ui-icons-222222-256x240.png) no-repeat -64px -16px !important;
    }
    #menubar ul li div span.ui-icon-caret-1-e {
      /* Caret on dropdowns */
      background:url(https://www.drupal.org/files/issues/ui-icons-222222-256x240.png) no-repeat -32px -16px !important;
    }

    Visualisation of irrational numbers as vectors

    Beauty in irrationality?

    Plotting irrational numbers (pi, e, sqrt2, golden ratio) as vectors allows their complexity to be visualised

    I have always wanted to visualise irrational numbers. Our brains are capable of recognising patterns in nature and I wanted to know if these patterns could be visualised in irrational numbers, and whether beautiful patterns could be seen that could lead to an further understanding of the irrational nature of the numbers. Just found out after publishing this article that the idea has been round for a while! (here is an interesting blog article). Here I have extended the technique to 3 dimensions for better visualisation and give results and computer code.

    Experimental Technique

    In this experiment the fractional parts of the irrational numbers, pi, e, sqrt2 and golden ratio are transformed into vectors in cartesian space for visualisation purposes. Each digit of the number sequence (from left to right) is transformed into a spatial vector with unit length. The orientation is calculated from the number as: angle = (digit/10)*2*pi. Sine and cosine functions are used to derive a position in the cartesian plane relative to the position of the previous digit (see code below for more details). As the irrational number is described to greater precision its decimal place increases, this occurs on the number string from left to right. As we are traversing the number sequence this corresponds to increasing time steps of the number analysis. On the plots the sequence position of the digit (its decimal place) is colour coded using a heat mapping (blue->red on increasing significant digits). The 3D plots also gives the sequence position of the digit on the Z axis, this helps to separate overlapping sequences in cartesian space.

    Visualisation/Results

    These plots are the results of the analysis, please click them for more detail

    2D plot of pi as vector 3D plot of pi as vector
    Fractional part of pi as a vector (colour blue->red (and Z axis) represents increasing number of decimal places) click to see enlarged image.
    2D plot of pi as vector 3D plot of pi as vector
    Fractional part of goldenratio as a vector (colour blue->red (and Z axis) represents increasing number of decimal places) click to see enlarged image.
    2D plot of pi as vector 3D plot of pi as vector
    Fractional part of sqrt2 as a vector (colour blue->red (and Z axis) represents increasing number of decimal places) click to see enlarged image.
    2D plot of e as vector 3D plot of e as vector
    Fractional part of e (natural logarithm base) as a vector (colour blue->red (and Z axis) represents increasing number of decimal places) click to see enlarged image.

    Here is a vector plot of 1 million random number generated numbers

    2D plot of e as vector 3D plot of e as vector
    Random numbers as a vector (colour blue->red (and Z axis) represents random digits in time generated by the Octave random number generator) click to see enlarged image.

    Data and Matlab/Octave computer code

    Below is the Matlab/Octave code used for generating the plots. Data can be downloaded here: pi, e, golden ratio, sqrt2 (data is without decimal point!)

    function  irrational_number_plot_as_vector(filepathname)
    %   requires file name containing string of irrational number delete decimal point from string ie 3.14... -> 314... 
    
    % read text file containing number
    format = "%1c"
    
    fileID = fopen('pi.txt','r');
    
    p = fscanf(fileID, format);
    
    _p=0;
    
    % convert character string to matlab array
    for i=1:length(p); _p(i)  = str2double(strcat(p(i),".0")); end
    
    % create arrays for plotting
    x_array = zeros(1,length(_p));
    y_array = zeros(1,length(_p));
    
    % polar angle
    for i=2:length(_p); x_array(i) = x_array(i-1)+cos((_p(i-1)/10.0)*2.0*pi); y_array(i) = y_array(i-1)+sin((_p(i-1)/10.0)*2.0*pi); end
    
    % surface plot with z axis and colour blue->red as increased fractional part
    h = surface([x_array(:), x_array(:)], [y_array(:), y_array(:)], [[1:length(_p)]', [1:length(_p)]'], [[1:length(_p)]', [1:length(_p)]'], 'EdgeColor','flat', 'FaceColor','none');
    
    end

    Upload tangram image to facebook

    Now you can upload an image featuring your completed tangrams to facebook

    There is a new feature on MegaTangram called “create tangram picture” it is accessible either from the menu or by double clicking on one of your completed tangrams in the top of the screen. You must be logged or have completed some puzzles to add them to the canvas area. Any completed tangrams can be used as stamps and individually resized and re-coloured. An image can also be uploaded and used as the picture background. Once you are happy with the picture it can be send to facebook using the facebook upload button (directly above the zoom control).

    User tangrams now displayed in the user home page area

    User tangram puzzles can now be saved and viewed in the user home page area.

    The user home page is a place where you can view all your completed puzzles. The tangram puzzle now has the ability to create your own tangram puzzles using unlimited amounts of the 7 tangram building block pieces.
    the user home page showing completed puzzles and user completed puzzles
    To do this just click on the user tangram button in the top right corner of the MegaTangram screen and start building your tangram design. To save your user tangram click the button again. The new puzzle will be added to the user home page and also shown in the completed puzzle area on the top of the puzzle screen.


    User tangram functionality

    Construct your own tangram picture using as many shapes as needed

    By clicking on the user tangram button a tangram picture can be designed. As many shapes as needed can be dragged from the bottom of the screen into the puzzle area to use making a pattern or picture. Zoom in and out and move the canvas around to give yourself more space in which to build. User tangrams can be seen on the user home page as well as in the MegaTangram game

    Understanding mortgages/loans

    How mortgages or loans companies make money from you

    The reason for this article is that in the past (whilst living in the UK) I have moved location and bought another house somewhere else like many people do. The mortgage company or bank said that they must cancel the mortgage and take out a new mortgage on the new house. It surprised me how little money I received back from the bank for the old mortgage for all those months that I had paid X hundreds of pounds paying back the mortgage (excluding the additional penalties for early termination!). So this article is going to look at the mortgage payments and give a few plots to illustrate what happens with your money.

    In our mortgage example we are going to borrow 140,000 pounds at an interest of 6.5% annually for a term lasting 30 years. The main calculation will be how much of the principal (amount borrowed is paid back every month). For this we will use the annuity formula, where `r` is the monthly interest rate expressed as a decimal (`r`=yearly_rate/12/100), `P` is the principal or the amount borrowed and `N` the number of months in the full term.

    `c=(r*P)/((1-(1+r)^-N))`

    Using this formula we can calculate our monthly payment (c=885 pounds). The other formula we need is for the debt schedule which tells us how much of the principal gets paid off every month which we will term `p`.

    `p=((1+r)*P’)-c`

    Where `P’` is the previous months outstanding amount (`p`) which at the beginning of the term will be equal to `P` (More information on the formulas used can be found here).

    I have generated a few plots from the formulas given above to try to demonstrate what happens to your money when you pay back a mortgage or loan. For example the plot of `p` vs `N` below shows a typical repayment curve for the borrowed money

    capital outstanding
    How the capital amount owed decreases with time

    You can see in this figure that the amount of the capital that you pay back in the beginning years is not much with most of the money being spent paying back the interest. This means that if you move early on in the term you wont get much money back from the mortgage, therefore it is better if possible to hang in there until the full term has ended.

    The next figure shows the proportions of the monthly mortgage payment split between capital and interest payments as the mortgage progresses. It actually takes 19 years 4 months before capital payments are greater than the interest payments in a 30 year mortgage.

    monthly repayment fractions
    Proportions of monthly mortgage payment that goes towards paying capital vs interest payments

    The final figure shows just how much extra money is made from lending the money and which proportion of this is interest or capital repayment. You actually pay more money towards interest than you do towards capital and the total money spent during the mortgage term is more than double the money borrowed.

    total amount of money paid
    Total Amount of money paid during lifetime of mortgage

    Thank you Wikkipedia, Gnumeric and MathJax

    Responsive social sharing toolbar

    The social tool bar featured on this site came from this excellent blog post. I really liked the social bar so I added it to the ejectamenta site. I have created some files to make it easy to install (click the links to download) responsive-share-bar.js and responsive-share-bar.css , and some 32×32 pixel image icons shareicons.zip. Save these files somewhere on your webserver and remember the path. Add this code in the head section of you

    <link rel="stylesheet" type="text/css" href="http://www.yourwebsitename.com/path/to/file/responsive-share-bar.css"/>

    Then add the reference to the javascript file just before the tag.

    <script async type="text/javascript" src=""http://www.yourwebsitename.com/path/to/file/responsive-share-bar.js"></script>

    Then copy the following html code to the body section of your webpage

    <div id="share-wrapper">
        <ul class="share-inner-wrp">
            <!-- Facebook -->
            <li class="facebook button-wrap"><a href="#">Facebook</a></li>
            
            <!-- Twitter -->
            <li class="twitter button-wrap"><a href="#">Tweet</a></li>
            
            <!-- linkedin -->
    		<li class="linkedin button-wrap"><a href="#">Linkedin</a></li>
            
            <!-- reddit -->
    		<li class="reddit button-wrap"><a href="#">Reddit</a></li>
       
            <!-- Digg -->
            <li class="digg button-wrap"><a href="#">Digg it</a></li>
            
            <!-- Stumbleupon -->
            <li class="stumbleupon button-wrap"><a href="#">Stumbleupon</a></li>
          
             <!-- Delicious -->
            <li class="delicious button-wrap"><a href="#">Delicious</a></li>
            
            <!-- Google -->
            <li class="google button-wrap"><a href="#">Google+</a></li>
            
            <!-- Email -->
            <li class="email button-wrap"><a href="#">Email</a></li>
        </ul>
    </div>

    For the linkedin summary field I get this from the meta-description tag on the page, so your page should have something like the following on it. If it is longer than 256 chars, linkedin say that they will truncate the string and use ellipses.

    <meta name='description' content='How to install a responsive toolbar for your website that works well on desktop and mobile websites'>

    That’s it, you should now have a good looking, slide out, and responsive social toolbar for your website, just like you see on the left of this page, please share if you like my site.

    All The code was webpage formatted using the CodeToHTML converter